Aug 23, 2024
Using Tableau and Salesforce in practice – Troubleshooting, Tricks, and Best Practices

Now that you have gained a solid understanding of the synergistic power of Salesforce and Tableau, it is time to convert this newfound knowledge into practice. Here are some practical steps to guide you in this exciting journey:

  • Think in terms of business needs: Always frame your application of Salesforce and Tableau in terms of what your business needs. Remember, technology should serve your business goals, not the other way around. Begin by identifying key business questions or challenges, then determine how Salesforce and Tableau can help address them.
  • Start small and scale: It can be tempting to apply your new knowledge across the entire business straight away. However, it is often beneficial to start small. Choose a specific project or team to pilot your initiatives, then gradually scale based on your successes.
  • Practice data visualization: Spend time honing your data visualization skills with Tableau. Data visualization is an art, and just like any art, it improves with practice. Explore different charts and dashboards, play with customization options, and learn what types of visualization best communicate different kinds of information.
  • Dive into Salesforce CRM: Make sure to get your hands dirty with Salesforce’s CRM functionalities. It is one thing to understand it theoretically, but experiencing it firsthand will cement your understanding and help you find ways to enhance your organization’s workflows.
  • Embrace the power of Einstein AI: Do not shy away from the advanced capabilities offered by Einstein AI. While AI might seem intimidating, remember that Einstein AI models require no coding and can greatly boost your analytic capabilities. Do not hesitate to experiment and explore how AI can benefit your organization.
  • Join the community: Salesforce and Tableau have vast, passionate communities full of experts willing to share their experiences and insights. Join forums, participate in webinars, and attend user group meetings. The knowledge and support you can find within these communities is invaluable.
  • Iterate and learn from mistakes: You are likely to face challenges as you begin implementing Salesforce and Tableau. Do not be disheartened. Use these challenges as learning opportunities. Adopt a mindset of continuous improvement, adjusting and refining your approach as you progress.
  • Stay up-to-date: Salesforce and Tableau are dynamic, evolving platforms. Make sure to stay updated with the latest features and improvements. Regularly check official blogs, attend product webinars, and subscribe to newsletters.

Remember, the journey from learning to practice is a marathon, not a sprint. Be patient with yourself, continue learning, and keep refining your skills. With time, you will become proficient in harnessing the combined power of Salesforce and Tableau to drive your organization forward.

More Details
Jun 13, 2024
Introduction– Troubleshooting, Tricks, and Best Practices

This chapter will summarize why Tableau and Salesforce are such a powerful combination, with an emphasis on their capabilities for data analysis, visualization, and decision-making. Additionally, the chapter will provide tips on how to get started using Tableau and Salesforce in practice, with guidance on best practices and useful resources. It will also contain guidance on troubleshooting common issues. The chapter will also explain how to continue the learning journey, including recommended further reading. Lastly, the chapter will help you start using the knowledge gained to improve your data analysis and decision making skills.

Structure

The chapter covers the following topics:

  • Tableau and Salesforce: a powerful combination
  • Trouble shooting guidance
  • Troubleshooting guidance
  • Continuing the learning journey

Objectives

This chapter is designed to provide learners with a thorough understanding of the combined use of Tableau and Salesforce for data analysis and visualization, highlighting their unique strengths and synergies. It delves into the reasons why integrating Tableau with Salesforce can significantly enhance business decision-making capabilities.

Learners will also be equipped with essential tips and best practices for effectively starting with Tableau and Salesforce in practical, real-world scenarios. Furthermore, the chapter includes strategies for troubleshooting common issues that may arise in the Tableau and Salesforce environments.

It also guides learners to discover a range of useful resources, tools, and platforms that can support their journey in mastering these technologies. The importance of continuous learning is emphasized, with strategies provided for staying current with the latest trends and developments in Tableau and Salesforce.

Additionally, learners will find recommendations for further reading that can deepen their understanding and proficiency in using these tools. Finally, the chapter aims to encourage and empower learners to confidently apply the knowledge and skills acquired from this book in their data analysis and decision-making tasks.

More Details
Mar 16, 2024
Other Einstein features– Exploring Einstein AI and Advanced Analytics

There are many other features that are part of the Salesforce Einstein offering that could fall under the rubric of advanced analytics. Here we will consider the following:

  • Einstein lead scoring: This advanced analytics product utilizes machine learning techniques to assign a lead score to each lead based on their likelihood of converting. The score ranges from 1-99 and helps prioritize the leads for sales teams. It also provides insights into the factors that contribute to a lead’s score. By analyzing historical data and identifying patterns, Einstein Lead Scoring makes data-driven predictions, enabling sales teams to focus on the most promising leads.
  • Einstein opportunity scoring: Like Einstein lead scoring, this advanced analytics product uses machine learning techniques to score opportunities based on their likelihood of becoming Closed Won. The scoring system ranges from 1-99, and the scores are available as a field on the opportunity record, in list views, reports, and on the forecast page. By identifying conversion patterns, Einstein Opportunity Scoring helps sales teams concentrate on high-priority opportunities while making data-backed predictions.
  • Einstein opportunity insights: This advanced analytics product draws on machine learning and data analysis techniques to provide predictions about which deals are likely to be won, reminders to follow up, and key moments in a deal process. By examining historical data and patterns, Einstein Opportunity Insights helps sales teams make informed decisions and prioritize their efforts.
  • Pipeline inspection (Einstein deal insights + Tiered Einstein opportunity scores): Pipeline inspection assists sales managers in monitoring their team’s forecast for a given time period by providing a consolidated view of pipeline metrics, opportunities, week-to-week changes, AI-driven insights, close date predictions, and activity information. With Einstein Deal Insights, the product predicts the likelihood of winning deals within the current month and provides additional insights from Einstein Opportunity Scoring and Cases. The tiered Einstein Opportunity Scores categorize scores into High, Medium, and Low tiers, making it easier for sales managers to track the progress and prioritize efforts effectively.
  • Einstein forecasting: Leveraging artificial intelligence technology, Einstein Forecasting brings more certainty and visibility to sales forecasts. It helps improve forecasting accuracy, provides forecast predictions, and offers suggestions for taking a better approach if projected performance is suboptimal. By examining historical data and trends, Einstein Forecasting can support sales teams with more accurate and data-driven forecasts.
  • Einstein account insights: This product uses advanced analytics techniques, such as sentiment analysis and text mining, to provide valuable information about accounts. account insights can help sales teams stay on top of news affecting their businesses, including account expansion or cost-cutting, changes in company leadership, and involvement in merger and acquisition talks. By identifying these insights, Einstein account insights helps teams make more informed decisions and take advantage of new opportunities.
  • Einstein automated contacts: This advanced analytics product uses email and event activity to find new contacts and opportunity contact roles to add to Salesforce, making the process more efficient for sales teams and admins. The product can either suggest new contacts to be added by sales team members or automatically associate opportunity contact roles in the background. By utilizing machine learning techniques, Einstein’s automated contacts streamline the process of managing contacts and opportunities in Salesforce.
  • Recommended connections: Although the word Einstein is not used in the product name, recommended connections is an AI-driven feature that provides suggestions for connecting with leads and contacts based on existing relationships within the company. The product showcases colleagues with the strongest connections to an individual, helping facilitate conversations with prospects. This intelligent feature can help sales teams make more meaningful connections by tapping into their colleagues’ networks and leveraging existing relationships.
More Details
Jan 30, 2024
Deeper dive in Einstein discovery – Exploring Einstein AI and Advanced Analytics

Salesforce: Advanced analytics capabilities

The following sections will dive into the advanced analytics capabilities within Salesforce and CRMA. This will teach you the options for working with advanced analytics within Salesforce prior to diving into the hands-on case.

Deeper dive in Einstein discovery

Einstein Discovery is a powerful tool within the context of advanced analytics. It can seamlessly incorporate Artificial Intelligence (AI) and machine learning into a business user’s workflow, allowing for the creation of predictive models without the need for data scientists or advanced developers. To truly leverage this platform’s potential, users must understand their data, interpret model outcomes, and correctly configure training datasets.

Advanced analytics involves sophisticated techniques and tools that delve beyond the traditional realm of BI to uncover deeper insights, make predictions, and offer recommendations. Einstein Discovery aligns with several aspects of advanced analytics, such as machine learning, pattern matching, and forecasting. Utilizing a no-code AI approach, the platform embeds algorithms to train its models, eliminating the need for manual coding.

Choosing the right features and incorporating business knowledge is an important process in utilizing Einstein Discovery effectively. Business representatives and data analysts need to collaborate from the start of the model development process. This collaboration ensures that the most relevant predictors are chosen and that the model’s outputs are aligned with business needs and goals.

Some key practices for model enhancement in Einstein Discovery include segmenting datasets into different models, handling multicollinearity, managing diverse inputs, detecting and handling outliers, and choosing the optimal bucketing method for every use case. It is essential to balance the accuracy that the model delivers with the need for understanding why the prediction was made, with business requirements often guiding these decisions.

Segmentation can improve prediction quality by creating separate models for different data segments, accommodating the behavior of each segment in the model. Tests such as examining distributions of input variables can be used to determine when segmentation is a viable strategy.

Multicollinearity occurs when dependent variables can be linearly predicted from each other, causing potential issues in model quality. Methods to address multicollinearity include a thorough investigation of data, understanding business relations between variables, and using Einstein Discovery to highlight problematic relationships.

Outliers can impact the accuracy and explainability of models. Detecting and managing outliers can improve model quality by reducing noise. Einstein Discovery can recommend an approach for handling outliers, but business input is crucial in the decision-making process.

Bucketing is an essential consideration in model quality and explainability. The right balance between optimal model metrics and clear explanations can be achieved by using different bucketing methods such as bucket by count, manual bucketing, bucket by width, or Einstein Discovery’s recommended buckets.

Lastly, adding explicit second-order variables representing interactions between different features can also improve model accuracy. However, this method should be used with caution, taking into account potential limitations such as the number of possible column value combinations and the variety of data reflecting those combinations.

Einstein Discovery provides a powerful means of advanced analytics by incorporating machine learning, pattern matching, and forecasting techniques seamlessly into the business user’s workflow. Close collaboration between business users and data analysts ensures that the right features are chosen and that the model is both accurate and relevant to the company’s goals. Adopting various model enhancement practices, such as strategically segmenting datasets and fine-tuning bucketing methods, can help perfect the insights provided by Einstein Discovery and maximize its value as an advanced analytics solution.

More Details
Dec 24, 2023
Tableau: Advanced analytics capabilities – Exploring Einstein AI and Advanced Analytics

Tableau and Salesforce provide powerful analytics capabilities that cater to both business users and data scientists. This comprehensive platform offers a wide range of features, including segmentation and cohort analysis, what-if and scenario analysis, sophisticated calculations, time-series and predictive analysis, and external services integration. By combining advanced analytics features with an intuitive interface, Tableau enables users to perform complex analyses and gain valuable insights from their data quickly and efficiently. Here are the applications:

  • Segmentation and cohort analysis Tableau enables quick, iterative analysis and comparison of segments to generate initial hypotheses and validate them. This section covers various capabilities in Tableau, such as:
  • Clustering: Tableau’s clustering feature uses unsupervised machine learning to segment data based on multiple variables.
  • Sets and set actions: Sets in Tableau allow defining collections of data objects either by manual selection or programmatic logic. Set Actions enable storing a selection of data points within a set, allowing for use cases like proportional brushing.
  • Groups: Groups in Tableau support creating ad-hoc categories and establishing hierarchies, which can help with basic data cleaning needs and structuring data intuitively for analysis tasks.
  • What-if and scenario analysis: Tableau enables users to experiment with inputs of their analysis and share scenarios while keeping data fresh using parameters and story points.
  • Parameters: Parameters in Tableau allow changing input values into a model or dashboard, driving calculations, altering filter thresholds, and selecting data.
  • Story points: Story points in Tableau enable constructing presentations that update with data changes and retain parameter values.
  • Sophisticated calculations: Tableau offers powerful capabilities to support complex logic using calculated fields. Two types of calculated fields that enable advanced analysis are:
    • Level of detail expressions: LOD Expressions in Tableau are an extension of the calculation language, enabling answering questions involving multiple levels of granularity in a single visualization.
    • Table calculations: Table calculations in Tableau enable relative computations applied to all values in a table and are often dependent on the table structure itself.
  • Time-series and predictive analysis: Tableau simplifies time-series analysis and offers predictive capabilities such as trending and forecasting.
  • Time-series analysis: Tableau’s flexible front end and powerful back end make time-series analysis a simple matter of asking the right questions.
  • Forecasting: Tableau’s forecasting functionality runs several different models in the background and selects the best one, automatically accounting for data issues such as seasonality.
  • External services integration: Tableau integrates with external services like Python, R, and MATLAB to expand functionality and leverage existing investments in other solutions.
  • Python, R, and MATLAB integrations: Tableau integrates directly with Python, R, and MATLAB, allowing users to call any function available in R or Python on data in Tableau and manipulate models created in these environments using Tableau.

In conclusion, Tableau’s advanced analytics capabilities make it a versatile and valuable tool for users at all levels of expertise. By offering a wide range of features, such as clustering, calculated fields, forecasting, and integration with Python, R, and MATLAB, Tableau empowers users to perform complex analyses and derive actionable insights from their data.

More Details
Aug 17, 2023
Conclusion – Blending Tableau with Traditional CRM Analytics

In this chapter, we have journeyed through the crucial domain of CRM Analytics and its paramount role in understanding, managing, and improving customer relationships. You should now be able to grasp the full picture of CRM Analytics, its key features, and how it facilitates thorough analysis of customer data through datasets and lenses.

The concept of Einstein Discovery within Salesforce, and its application in the CRM Analytics platform, was another essential part of our journey. Now, you should be capable of creating and utilizing Einstein Discovery models to enhance your data interpretation and decision-making processes.

Finally, we discussed the use of the CRM Analytics Tableau Output Connector, a bridge that allows Salesforce data to flow seamlessly into Tableau. This key tool enables you to perform detailed, insightful analysis of your Salesforce data, further enriching your understanding and enabling you to derive practical benefits.

In sum, we have armed you with a comprehensive understanding of CRM Analytics within Salesforce, its integration with Tableau, and the immense value these tools bring to your organization. Now, you should feel confident to apply these skills in your own work, harnessing the power of CRM Analytics and Tableau to transform raw data into strategic actions, and thereby improve your business operations and customer relationships.

We will now move on to putting our hard work on setting up CRMA to use inside Tableau for advanced analytics use cases, while also covering the basics of what advanced analytics are really all about in the process.

Join our book’s Discord space

Join the book’s Discord Workspace for Latest updates, Offers, Tech happenings around the world, New Release and Sessions with the Authors:

https://discord.bpbonline.com

More Details
Mar 13, 2023
Making a dashboard – Blending Tableau with Traditional CRM Analytics

A dashboard is an engaging compilation of widgets that display the results of data queries. In this section, you will create a dashboard with an interactive chart and a list widget. You will incorporate the lens from the previous step and explore tools in the dashboard designer.
To incorporate a lens into a dashboard, you need to clip it. Clipping the lens allows CRM Analytics to add the query as a step in a new dashboard (or the most recently used open dashboard).

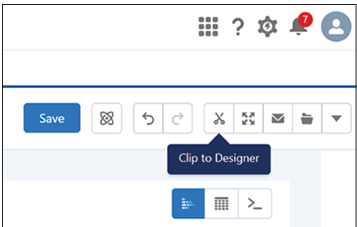
  1. In your newly created lens, click the Clip to Designer icon, marked in the following screenshot, to clip the query.

Figure 8.20: Clip to designer icon

  1. Under Display Label, enter Breakdown by Industry and click Clip to Designer.
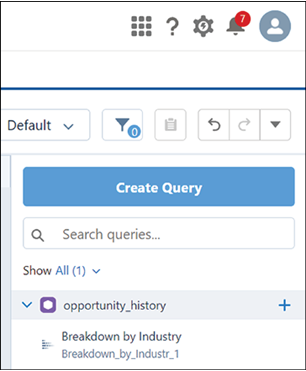
  2. CRM Analytics will open the dashboard designer and add the query in the query panel. Breakdown by Industry will be displayed under the opportunity_history dataset.

Figure 8.21: Lens added to designer with query name showing

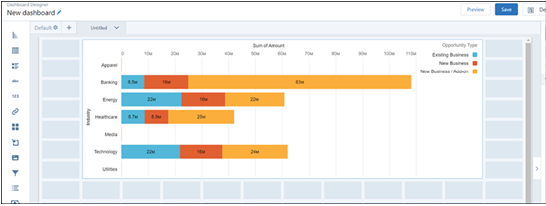
  1. Drag the Breakdown by Industry query onto the new dashboard grid.
  2. Resize the chart by dragging its corner to make it larger. The result should look like the following screenshot:

Figure 8.22: Query chart resized on dashboard
Widgets are the basic building blocks of a dashboard, providing various functions such as displaying key performance indicators, filtering dashboard results, visualizing data using interactive charts, or showing record-level details in tables. In this step, you will add a list widget to enable dashboard users to facet all the charts in the dashboard.

  1. Drag the List widget icon, shown in the screenshot, from the left side onto an empty space on the dashboard underneath the chart.

Figure 8.23: List widget being added to dashboard

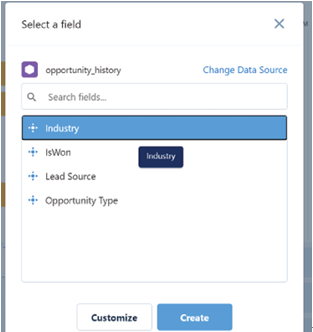
  1. Click on the List widget and select Industry.
  2. Click Create in the window shown in the next screenshot:

Figure 8.24: Industry field selected for list

  1. Select the list widget by clicking on it.
  2. In the Properties panel on the right, click the Query tab.
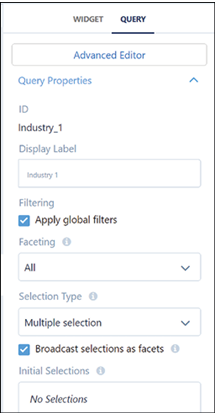
  3. Ensure that both Apply global filters and Broadcast selections as facets are selected.
  4. Under Selection Type, choose Multiple Selection, shown in Figure 8.25:

Figure 8.25: List widget properties

  1. Save your dashboard by clicking the Save button.
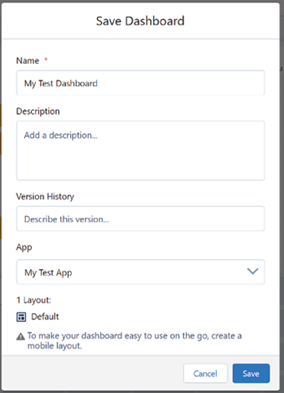
  2. Enter My Test Dashboard as the title of your new dashboard, and select App | My Test App from the dropdown menu, as shown below:

Figure 8.26: Save dashboard dialogue

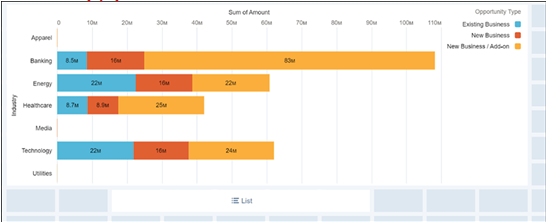
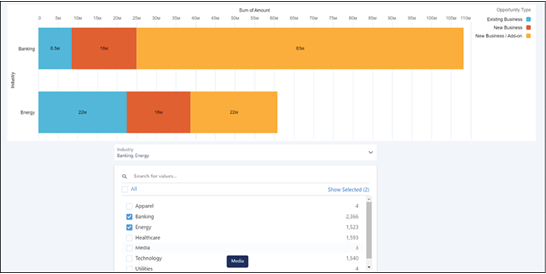
  1. Click Save to complete the process. You can preview your dashboard, which should look like this:

Figure 8.27: Completed test dashboard
You have now created a basic dashboard. We hope you will explore the potential of CRM Analytics much further on your own, but for now we will move on to Einstein Discovery, the machine learning engine that powers CRM Analytics.

More Details
Dec 4, 2022
Importing a dataset – Blending Tableau with Traditional CRM Analytics

Importing a dataset

CRM Analytics can work with many different kinds of data, both internal to the Salesforce platform and external, such as in a Snowflake data warehouse. To keep things simple, we will simply get our data from a CSV file. Start by downloading the file: https://developer.salesforce.com/files/opportunity_history.csv. This file is used for several Salesforce tutorials, and we will make use of it as well, for instance: https://trailhead.salesforce.com/content/learn/modules/einstein-discovery-basics/build-your-crm-analytics-dataset.

Our next step is, therefore to import the data from the CSV file into a CRM Analytics dataset, which can be done using the following steps:

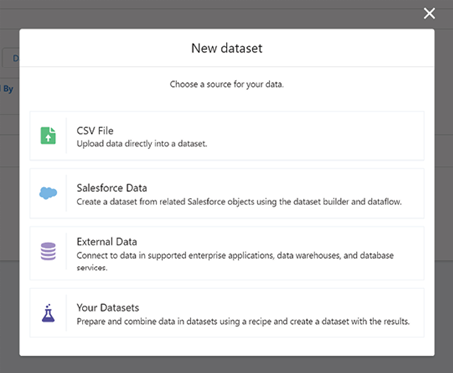
  1. On the Analytics Studio home tab, click Create, select Dataset, and then choose CSV File, as shown in Figure 8.5:

Figure 8.5: Dataset creation menu showing CSV file option

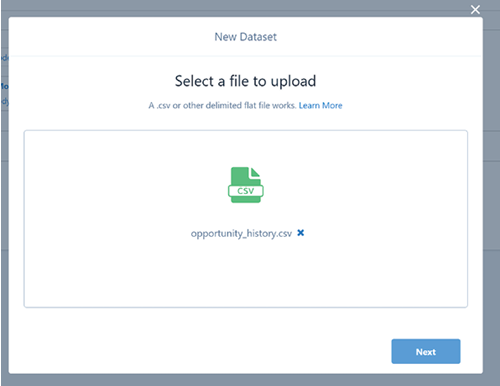
  1. In the file-selection window that opens, locate the CSV file you downloaded, opportunity_history.csv, select it and then click Next. You can see this in the following screenshot:

Figure 8.6: File selection dialogue

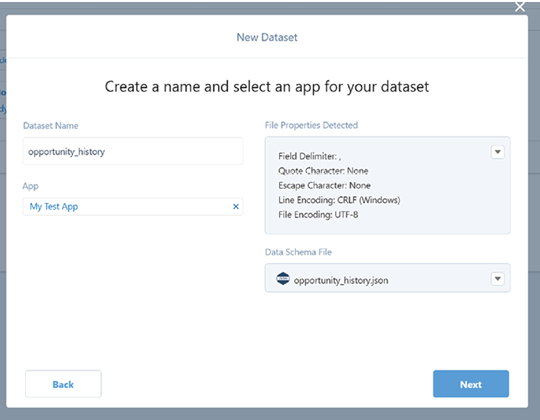
  1. In the Dataset Name field, you can change the default name (opportunity_history), as shown below. By default, Analytics Studio uses the file name as the dataset name, which cannot exceed 80 characters as shown in the following figure:

Figure 8.7: Dataset name field

  1. Choose the app where you want to create the dataset. By default, Analytics Studio selects My Test App.
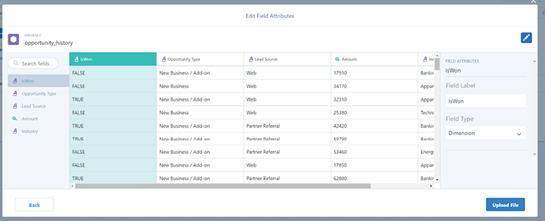
  2. Click Next. The Edit Field Attributes screen appears, shown in Figure 8.8, where you can preview the data and view or edit the attributes for each field.

Figure 8.8: Edit field attributes screen

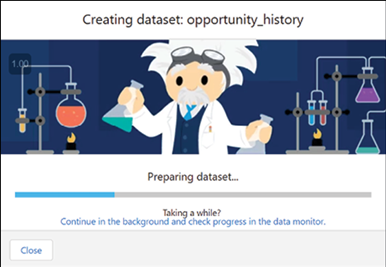
  1. For now, accept the defaults and click Upload File. Analytics Studio uploads the data, prepares, and creates the dataset while showing progress as it occurs. You can see this in the following screenshot:

Figure 8.9: File upload progress
Once finished, you will see details about the dataset you created. If you do not see the dataset details, check your Datasets or search for opportunity_history in Analytics Studio.

More Details
Nov 8, 2022
Creating an analytics app – Blending Tableau with Traditional CRM Analytics

A CRM Analytics app is a comprehensive collection of analyses, data exploration paths, and powerful tools designed for in-depth, real-time data examination. CRM Analytics relies on apps to organize data projects, run presentations directly from dashboards, and manage asset sharing.
To get started with creating an app in your CRM Analytics-enabled Developer Edition org, follow these steps:

  1. Open your CRMA Developer Edition org.
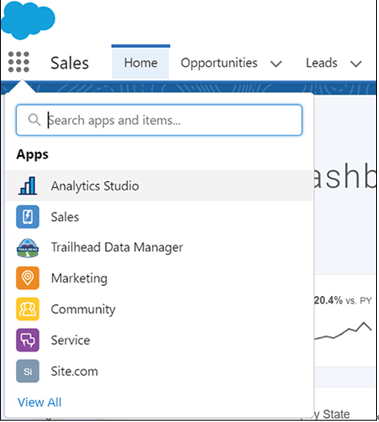
  2. Access the App Launcher and search for Analytics Studio. Select it to open Analytics Studio in a new tab. Keep both tabs open, as you will need to work on the original tab later in the project. This is shown in the following screenshot:

Figure 8.1: App Launcher showing Analytics Studio

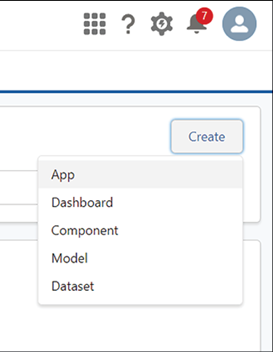
  1. In Analytics Studio, click the Create button and select App from the dropdown menu, as shown below:

Figure 8.2: Create menu dropdown showing App option

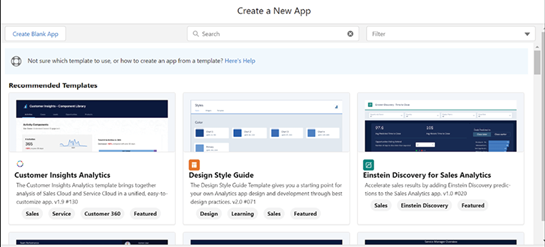
  1. Choose Create Blank App to start with a clean slate, as shown in the following screenshot:

Figure 8.3: Blank App creation dialogue

  1. Click Continue to proceed to the next step. Enter My Test App as the name of your new app, as shown below:

Figure 8.4: My Test App creation dialogue

  1. Click Create to finalize the app creation process.
    Congratulations! You have successfully created an app in CRM Analytics. We will now move on to importing a dataset.
More Details
Oct 16, 2022
Creating Datasets, Lenses, and Dashboards in CRM Analytics – Blending Tableau with Traditional CRM Analytics

In CRM Analytics, the most basic concepts are app, dataset, lens, and dashboard. These are the basic building blocks to understand to be able to work in the system, although, of course, they are just the beginning.

Before we dive into the practical steps of creating a dashboard in CRM Analytics, let’s briefly familiarize ourselves with the fundamental concepts of app, dataset, lens, and dashboard. Understanding these components is crucial as they form the backbone of CRM Analytics.

  • App: In CRM Analytics, an app serves as a container for your analytical projects. It’s a workspace where you can organize your datasets, lenses, and dashboards. Think of it as a folder on your computer where you keep related files together for easy access and organization.
  • Dataset: A dataset is a collection of data that CRM Analytics can process. This data can come from various sources, including Salesforce records, external databases, or files like CSVs. Datasets are the raw materials from which you extract insights.
  • Lens: A lens is a tool for exploring a dataset. It allows you to visualize data in different formats (such as charts or tables), filter the data to focus on specific aspects, and perform basic analyses. You can think of a lens as a magnifying glass that helps you examine the details of your dataset.
  • Dashboard: A dashboard is a visual representation of your data analyses, often comprising multiple widgets (charts, tables, etc.) that display data from one or more datasets. Dashboards are designed to provide at-a-glance insights and support decision-making.

Now that we have a basic understanding of these concepts, let’s proceed to create a simple dashboard in CRM Analytics to give you a feel for what you might be able to achieve if you were to dig deeper into the topic.

We will do this in a few steps:

  1. Create an app to hold your unique analytical assets.
  2. Import a dataset into the system.
  3. Explore this dataset through a lens.
  4. Build a simple dashboard to visualize the data.

Doing this will also teach you some of the key differences between creating dashboards in Tableau and doing so in CRM Analytics and why you might prefer one over the other in particular cases.

Let us begin!

More Details