Aug 23, 2024
Using Tableau and Salesforce in practice – Troubleshooting, Tricks, and Best Practices

Now that you have gained a solid understanding of the synergistic power of Salesforce and Tableau, it is time to convert this newfound knowledge into practice. Here are some practical steps to guide you in this exciting journey:

  • Think in terms of business needs: Always frame your application of Salesforce and Tableau in terms of what your business needs. Remember, technology should serve your business goals, not the other way around. Begin by identifying key business questions or challenges, then determine how Salesforce and Tableau can help address them.
  • Start small and scale: It can be tempting to apply your new knowledge across the entire business straight away. However, it is often beneficial to start small. Choose a specific project or team to pilot your initiatives, then gradually scale based on your successes.
  • Practice data visualization: Spend time honing your data visualization skills with Tableau. Data visualization is an art, and just like any art, it improves with practice. Explore different charts and dashboards, play with customization options, and learn what types of visualization best communicate different kinds of information.
  • Dive into Salesforce CRM: Make sure to get your hands dirty with Salesforce’s CRM functionalities. It is one thing to understand it theoretically, but experiencing it firsthand will cement your understanding and help you find ways to enhance your organization’s workflows.
  • Embrace the power of Einstein AI: Do not shy away from the advanced capabilities offered by Einstein AI. While AI might seem intimidating, remember that Einstein AI models require no coding and can greatly boost your analytic capabilities. Do not hesitate to experiment and explore how AI can benefit your organization.
  • Join the community: Salesforce and Tableau have vast, passionate communities full of experts willing to share their experiences and insights. Join forums, participate in webinars, and attend user group meetings. The knowledge and support you can find within these communities is invaluable.
  • Iterate and learn from mistakes: You are likely to face challenges as you begin implementing Salesforce and Tableau. Do not be disheartened. Use these challenges as learning opportunities. Adopt a mindset of continuous improvement, adjusting and refining your approach as you progress.
  • Stay up-to-date: Salesforce and Tableau are dynamic, evolving platforms. Make sure to stay updated with the latest features and improvements. Regularly check official blogs, attend product webinars, and subscribe to newsletters.

Remember, the journey from learning to practice is a marathon, not a sprint. Be patient with yourself, continue learning, and keep refining your skills. With time, you will become proficient in harnessing the combined power of Salesforce and Tableau to drive your organization forward.

More Details
May 27, 2024
Combining Salesforce and Tableau for Advanced Analytics– Exploring Einstein AI and Advanced Analytics-2

We will test our Einstein Discovery model on the raw CSV that we used to create the model in the first place, follow the below mentioned steps:

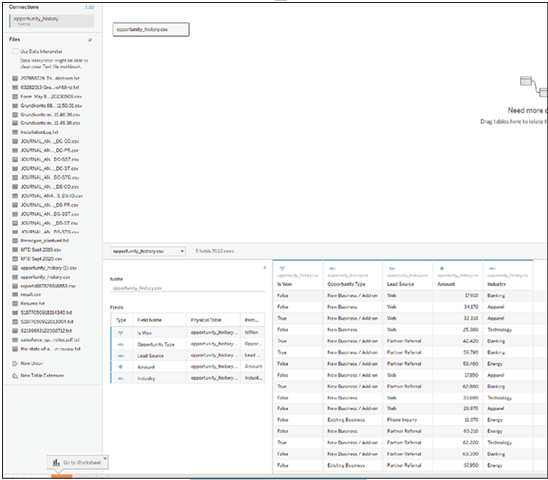
  1. Start by creating a new Tableau workbook and connect to the opportunity_history.csv file you downloaded. You can see how this should look in Figure 9.10:

Figure 9.10: Connect Tableau to CSV

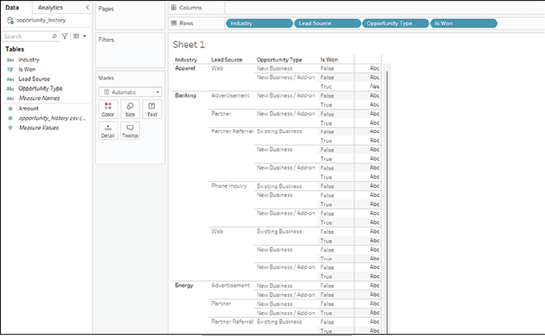
  1. Create a worksheet, like the one shown in Figure 9.11, with the four fields Is Won, Industry, Lead Source, and Opportunity Type. You can format this worksheet as you like, as long as the fields are present.

Figure 9.11: Create worksheet

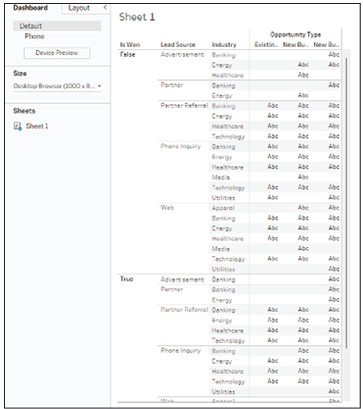
  1. Now add a dashboard to the workbook and add the worksheet you have just created to it. You can see how this should look in Figure 9.12:

Figure 9.12: Add dashboard

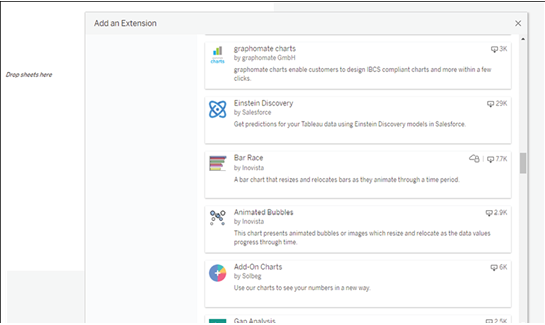
  1. On the dashboard, add an Extension of type Einstein Discovery, as shown in Figure 9.13:

Figure 9.13: Add Einstein Discovery extension

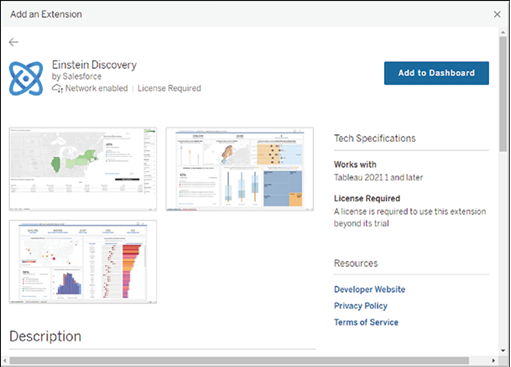
  1. Click add to Dashboard, as shown in Figure 9.14:

Figure 9.14: Add extension to dashboard

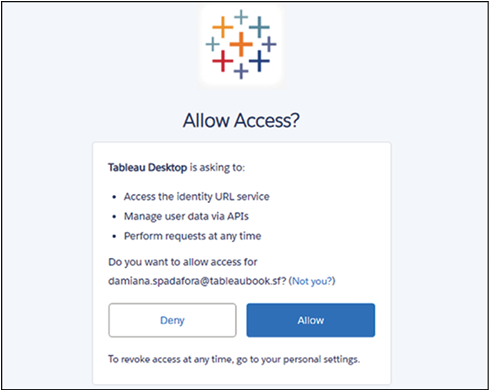
  1. You will now have to authenticate against your Salesforce org and allow your Tableau Desktop installation to access it. You can see this screen in Figure 9.15:

Figure 9.15: Authenticate Salesforce access

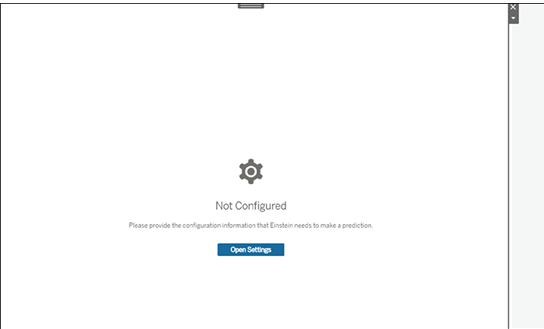
  1. The extension will now need to be configured, so click Open Settings, shown in Figure 9.16:

Figure 9.16: Open extension settings

  1. If you get an error at this point, you probably need to add the CRM Analytics Admin permission set to the user you are logged in as.
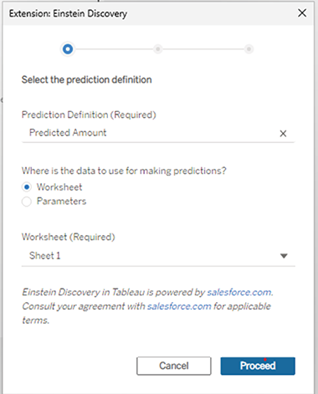
  2. Select the Predicted Amount model and the sheet you have just created in the dialog, shown in the following figure:

Figure 9.17: Select model and worksheet

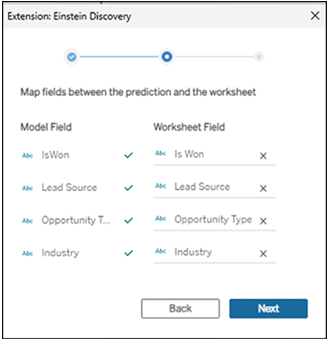
  1. Map the fields to their worksheet equivalents, following the example in Figure 9.18:

Figure 9.18: Map fields

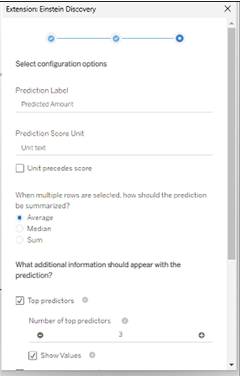
  1. Leave all fields at their default values in the final screen, as shown in Figure 9.19:

Figure 9.19: Extension settings

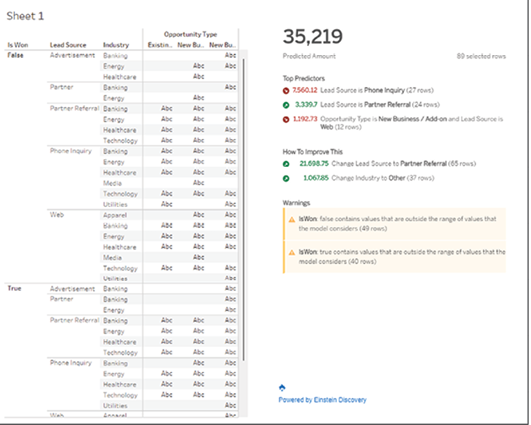
  1. You can now see your Einstein Discovery model directly in the worksheet and use standard worksheet controls to navigate and filter it. This should look like the Figure 9.20:

Figure 9.20: View predictions in worksheet
Congratulations, that was a hard task. Now, take a little break before going onto the final chapter in this book that deals with troubleshooting common issues and where to go from here.

Conclusion

Congratulations on reaching the conclusion of this rich journey into advanced analytics with Tableau and Salesforce! By now, you should have a solid understanding of the concept of advanced analytics and how it can elevate our data exploration to provide deeper insights and predictions.

Throughout this chapter, we have unlocked the power of Tableau’s advanced analytics, admired the intelligence of Salesforce’s Einstein platform, and learned how they can be harnessed to make data-driven decisions. We have also explored the synergy of these two platforms and their combined potential in enhancing your data analysis capabilities.

Remember, the field of advanced analytics is ever evolving, with new techniques and technologies constantly emerging. What you’ve learned here serves as a robust foundation, but there’s always more to discover and master. As we continuously strive for better data comprehension and predictive prowess, these tools will prove to be invaluable assets. Keep practicing, experimenting, and pushing the boundaries.

We will now move on to the final chapter of our book.

Join our book’s Discord space

Join the book’s Discord Workspace for Latest updates, Offers, Tech happenings around the world, New Release and Sessions with the Authors:

https://discord.bpbonline.com

More Details
Apr 5, 2024
Combining Salesforce and Tableau for Advanced Analytics– Exploring Einstein AI and Advanced Analytics-1

To give an example of how you might combine Tableau and Salesforce to achieve advanced analytical use cases, we will bring the Einstein Discovery prediction model that you created in Chapter 8, Blending Tableau with Traditional CRM Analytics into Tableau Desktop. If you have not already completed the setup of this Einstein Discovery model, now is the time to do so.
We will employ the Tableau Einstein Discovery connector to bring the predictions into our Tableau environment, and thereby we will learn one of the most important ways of combining CRM Analytics with Tableau Desktop to get more out of both.
To start with, let us get the connection set up. Please follow the steps below to set up the connection between Tableau Desktop and Einstein Discovery:

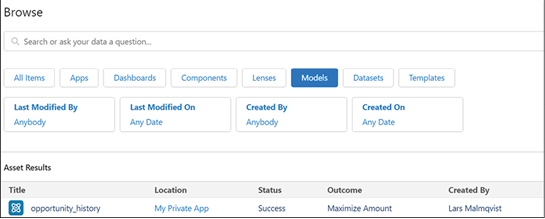
  1. Go to your model from Chapter 8 in Analytics Studio. It can be reached via Browse |Models, as shown in Figure 9.1:

Figure 9.1: Deploy model screen in Analytics Studio

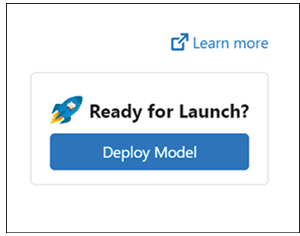
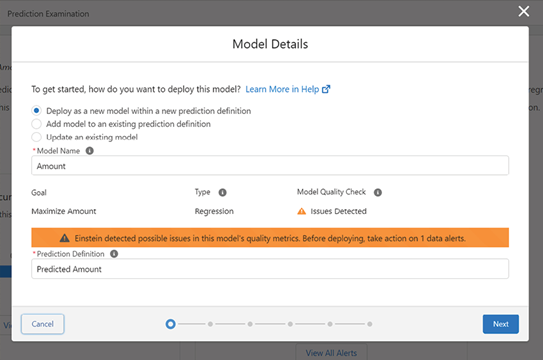
  1. Now open your model and deploy it by clicking Deploy Model; this will make it usable from Tableau Desktop, among other places. You can see this in the Figure 9.2:

Figure 9.2: Model deployment options

  1. Leave the defaults as is and ignore any model warnings; they are not relevant to the example. See the warning in the Figure 9.3:

Figure 9.3: Ignore warnings

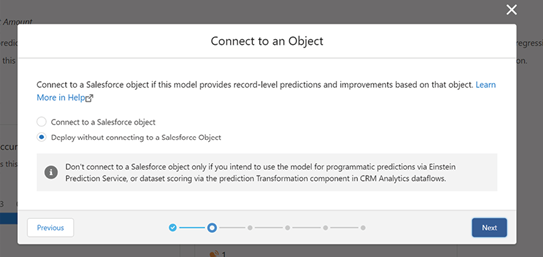
  1. On the following screen, select Deploy without connecting to a Salesforce object, as we are not writing back to the CRM but using it from Tableau. You can see this in Figure 9.4:

Figure 9.4: Deployment settings

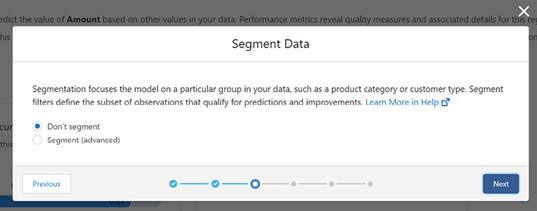
  1. We will not be segmenting our data, although it is worth noting this capability for future investigation, so select Don’t segment, as shown in Figure 9.5:

Figure 9.5: Segmentation options

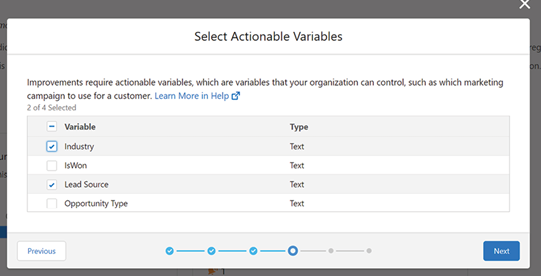
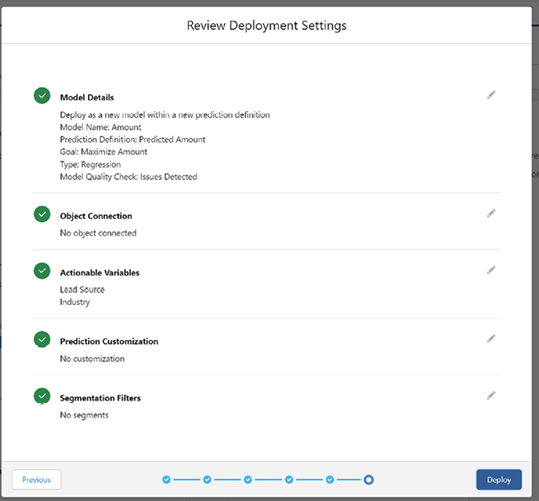
  1. Under Actionable variables, indicated in Figure 9.6, select Lead Source and Industry” as these are within our gift to influence, although not fully control.

Figure 9.6: Actionable variables

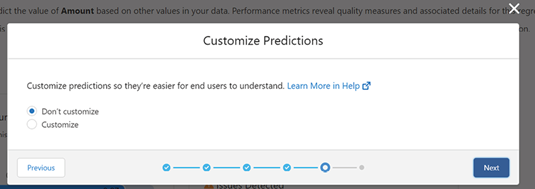
  1. At this point, we will not customize our predictions. Therefore, select Don’t customize, as shown below.

Figure 9.7: Customization options

  1. Click Deploy to deploy the model, as shown in Figure 9.8:

Figure 9.8: Deploy model

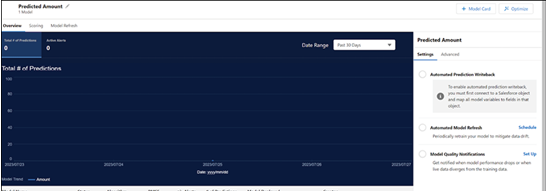
  1. When you are redirected to a screen as shown Figure 9.9, you are ready to proceed to the next stage.

Figure 9.9: Model deployed

More Details
Feb 27, 2024
Einstein prediction builder – Exploring Einstein AI and Advanced Analytics

Einstein Prediction Builder is a powerful tool within the Salesforce Einstein platform that enables users to create custom predictions for specific business use cases. It simplifies the process of predictive analytics by automating most technical aspects, such as algorithms, parameter tuning, and infrastructure management. In the context of advanced analytics, Einstein Prediction Builder’s capabilities streamline the process of building, analyzing, and deploying machine learning models, resulting in deeper insights and better decision-making.

Advanced analytics goes beyond traditional business intelligence to discover deeper insights, make predictions, or generate recommendations using techniques such as data mining, machine learning, pattern matching, forecasting, visualization, semantic analysis, and more. Einstein Prediction Builder’s capabilities align with advanced analytics as it involves the use of machine learning to make predictions based on historical data and analyze the performance of these predictions to drive better business outcomes.

The Einstein Prediction Builder simplifies the entire prediction workflow by breaking it down into six steps: defining the use case, identifying the data that supports the use case, creating the prediction, reviewing and iterating the prediction, monitoring the prediction, and deploying and using the prediction.

The following steps can be used when implementing predictions with Einstein Prediction Builder:

  1. Define your use case.

The process begins by identifying a business outcome that needs improvement, such as increasing lead conversion rates, improving customer satisfaction scores, or reducing churn.

  1. Identify the data that supports your use case.

With a clear use case, users can frame their prediction using the “Avocado Framework”, which helps segment the data, identify examples of outcomes, and distinguish between historical data for training and new data for making predictions.

  1. Create your prediction.

Einstein Prediction Builder’s wizard enables users to set up predictions quickly by selecting the data object, specifying the question to be answered (binary or numeric), configuring positive and negative examples, and selecting the fields to be included or excluded from the analysis.

  1. Review, iterate and enable your prediction.

Once the prediction is created, a scorecard is generated that provides information on the quality of the prediction. Users can review and revise their prediction based on the scorecard metrics and insights, remove any potential biases, and enable the prediction.

  1. Monitor your prediction.

After enabling the prediction, it is recommended to let it run for a period of time behind the scenes so that its performance can be assessed on new data. Users can verify the model’s accuracy using Salesforce reports or by utilizing the Einstein Prediction Builder Model Accuracy Template.

  1. Deploy and use your prediction.

Finally, the prediction can be integrated into the business processes using list views, lightning components, Process Builder, or Einstein Next Best Action strategies. Monitoring KPIs, performing a phased rollout, and periodically reviewing the model’s assumptions and performance are essential for success.
In summary, Einstein Prediction Builder simplifies the complex process of creating machine learning models and applying advanced analytics concepts to deliver actionable insights. By streamlining the prediction workflow, users can quickly generate predictions, analyze their performance, and efficiently integrate them into business processes. This tool makes advanced analytics more accessible and easier to use for driving better business decisions.

More Details
Oct 7, 2023
Advanced analytics – Exploring Einstein AI and Advanced Analytics

Advanced Analytics involves the independent or partially independent analysis of data or content using complex methods and tools. These often surpass the capabilities of standard Business Intelligence (BI), allowing for the uncovering of more profound insights, the making of predictions, or the provision of suggestions. Techniques employed in advanced analytics encompass data or text mining, machine learning, pattern identification, forecasting, visual representation, semantic and sentiment analysis, network and cluster analysis, multivariate statistics, graph analysis, simulation, complex event processing, and neural networks.

Advanced analytics applications in businesses are broad and varied, covering areas such as customer acquisition and retention, marketing efforts enhancement, risk management, and product development and innovation.

With the aid of advanced analytics, businesses can identify customer preferences, target their marketing efforts, foresee potential risks, and innovate in product development. Let us delve deeper into these applications:

  • Customer acquisition and retention: Advanced analytics can process customer interaction data, market research, and feedback to identify customer preference trends. Salesforce’s intelligent Customer 360 platform can be used here to provide a unified customer view, allowing businesses to meet and exceed customer expectations effectively.
  • Enhancing marketing efforts: Machine learning, business intelligence, and predictive modeling can enable companies to develop sophisticated marketing campaigns. Salesforce Marketing Cloud can assist in delivering personalized experiences to customers, tracking real-time behavior changes, and making data-driven decisions.
  • Improving risk management: Advanced analytics tools can model scenarios and forecast risks, guiding enterprises toward strategic risk management plans. Salesforce Shield provides a set of integrated services for managing business risks, from archiving sensitive data to implementing fine-grained user permissions.
  • Product development and innovation: By analyzing customer needs, advanced analytics tools can identify areas of improvement and potential new product niches. Salesforce’s Product Development Cloud can manage the entire lifecycle of product development, from ideation to launch.

Real-world applications of advanced analytics

Various global brands have harnessed the power of advanced analytics to drive their success. For instance, Amazon uses advanced analytics to provide personalized customer experiences. Starbucks optimizes its menu and product offerings through data analytics. American Express uses predictive modeling to anticipate potential customer churn and optimize marketing efforts.

Tableau, with its powerful data visualization capabilities, can be used to replicate these successes by presenting complex data in an understandable and actionable format. Whether it is predicting customer behavior like Amazon, optimizing product offerings like Starbucks, or forecasting customer churn like American Express, Tableau is a versatile tool in the hands of data scientists and analysts.

Advanced analytics is crucial for fostering innovation and improving business operations. By utilizing predictive analytics, businesses can make better-informed decisions and model outcomes beforehand. This capability allows businesses to craft strategic plans for all areas of operations, from customer service to digital marketing.

With technology’s evolution, the potential applications and capabilities of data science tools, like Salesforce and Tableau, are continually expanding. This advancement has reflected in the growing number of organizations planning to integrate advanced analytics into their decision-making models.

The future of advanced analytics will likely see more complex algorithms, more data science, and more process automation. Both Salesforce and Tableau, with their robust and continually improving features, are well-positioned to support this evolution.

More Details
Aug 17, 2023
Conclusion – Blending Tableau with Traditional CRM Analytics

In this chapter, we have journeyed through the crucial domain of CRM Analytics and its paramount role in understanding, managing, and improving customer relationships. You should now be able to grasp the full picture of CRM Analytics, its key features, and how it facilitates thorough analysis of customer data through datasets and lenses.

The concept of Einstein Discovery within Salesforce, and its application in the CRM Analytics platform, was another essential part of our journey. Now, you should be capable of creating and utilizing Einstein Discovery models to enhance your data interpretation and decision-making processes.

Finally, we discussed the use of the CRM Analytics Tableau Output Connector, a bridge that allows Salesforce data to flow seamlessly into Tableau. This key tool enables you to perform detailed, insightful analysis of your Salesforce data, further enriching your understanding and enabling you to derive practical benefits.

In sum, we have armed you with a comprehensive understanding of CRM Analytics within Salesforce, its integration with Tableau, and the immense value these tools bring to your organization. Now, you should feel confident to apply these skills in your own work, harnessing the power of CRM Analytics and Tableau to transform raw data into strategic actions, and thereby improve your business operations and customer relationships.

We will now move on to putting our hard work on setting up CRMA to use inside Tableau for advanced analytics use cases, while also covering the basics of what advanced analytics are really all about in the process.

Join our book’s Discord space

Join the book’s Discord Workspace for Latest updates, Offers, Tech happenings around the world, New Release and Sessions with the Authors:

https://discord.bpbonline.com

More Details
May 3, 2023
Creating an Einstein Discovery Model and using it from CRM Analytics – Blending Tableau with Traditional CRM Analytics

Einstein Discovery, a cutting-edge machine learning platform developed by Salesforce, is designed to bring transparent predictions and recommendations to users within Tableau workflows and in Salesforce CRM. This powerful tool enables data scientists, analysts, and business users to create predictive models without writing any algorithms. With its intuitive, no-code environment, Einstein Discovery empowers individuals and organizations to make smarter, more informed decisions guided by ethical and transparent AI.
In this section, we will create an Einstein Discovery model based on our opportunity history data and investigate it within CRM Analytics. In Chapter 9 – Exploring Einstein AI and Advanced Analytics, we will examine how to use this model from within Tableau.
To create a model and investigate its parameters, use the following steps:

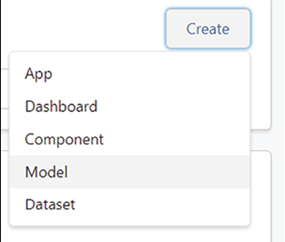
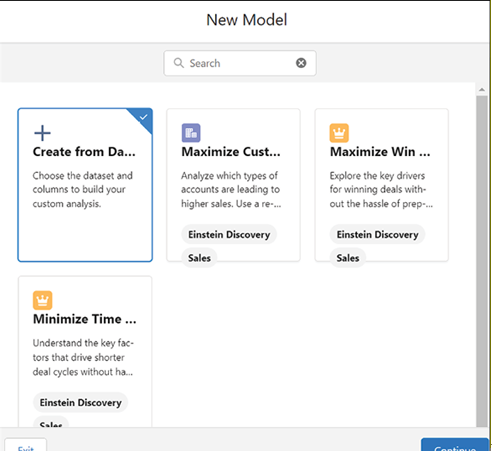
  1. Go to Analytics Studio and click Create | Model, as demonstrated in the following screenshot.

Figure 8.28: Model creation dialogue

  1. Choose Create from Dataset in the dialogue that appears, shown below:

Figure 8.29: Create from dataset dialogue

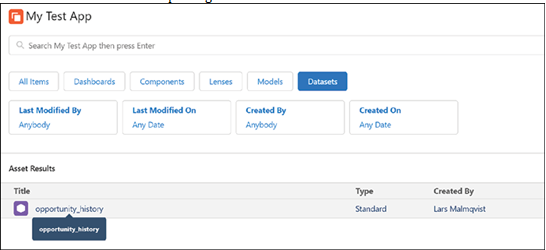
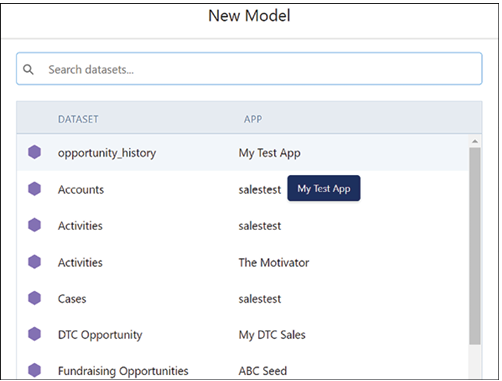
  1. Now select the opportunity_history dataset that we have previously created, as indicated in the following screenshot:

Figure 8.30: opportunity_history dataset selected

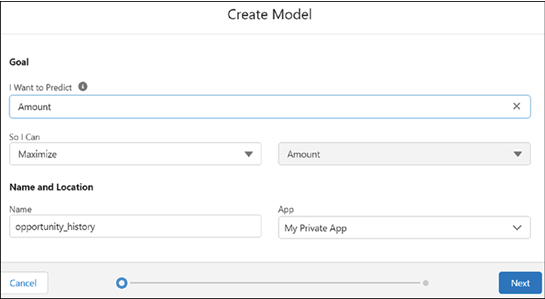
  1. As the goal, follow the settings in the following screenshot to maximize the amount of the opportunity:

Figure 8.31: Model goal configuration
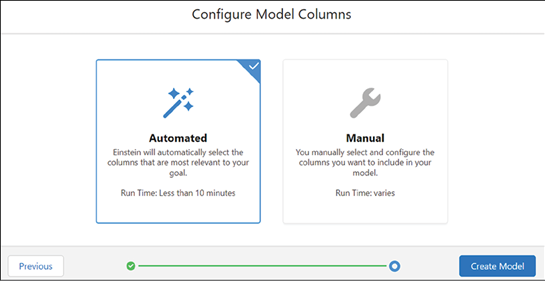
Einstein Discovery allows for considerable freedom in manually configuring the model that you want. However, for the purposes of this exercise, we will simply allow it to make the decisions itself. Therefore, select Automated in the Configure Model Columns dialogue. Note that this does mean we will take into account whether the opportunity was won or not, which you may want to exclude in a real scenario. However, in this scenario, the influence is not huge, so keeping it in does not materially change the result. You can see this in the following screenshot:

Figure 8.32: Automated configuration selected
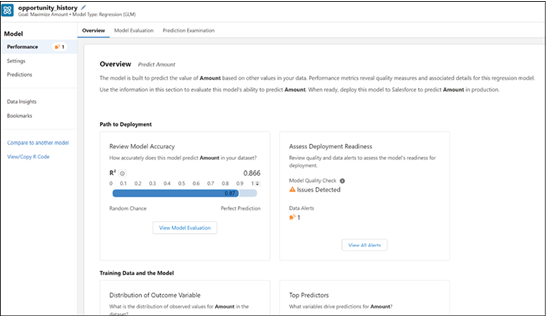
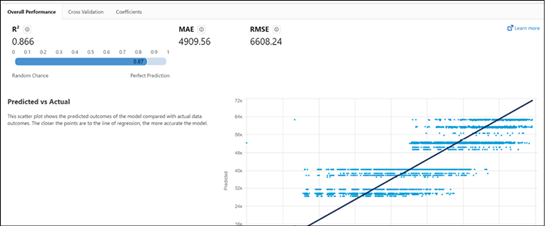
The system will now build your model, which usually takes 5 to 10 minutes. When it is done, you should see the following overview. You can check the alert and also note that at the highest level, shown in the screenshot below, the model’s prediction seems fairly good.

Figure 8.33: Model overview showing performance
If you now click on the Model Evaluation tab, you can see more detail about the model performance. This is shown in Figure 8.34:

Figure 8.34: Model evaluation report
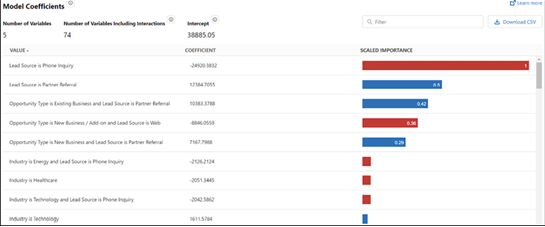
It is also worth going into the Model Coefficients tab, shown below, where you can see the most important variables in the model for predicting the opportunity amount.

Figure 8.35: Model coefficients tab
Now go into the Prediction Examination tab, shown in the following screenshot, where you can see how the model classified actual data from the training dataset. This can give you a good sense of how it will work in practice.

Figure 8.36: Prediction examination tab
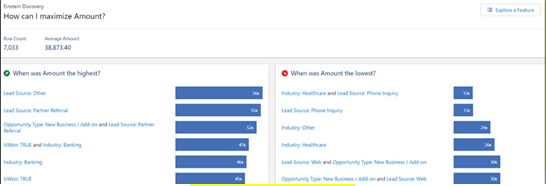
On the Data Insights tab, shown in Figure 8.37, accessible from the sidebar, you get an overview of what factors play the biggest role in making the amount high or low.

Figure 8.37: Data insights overview
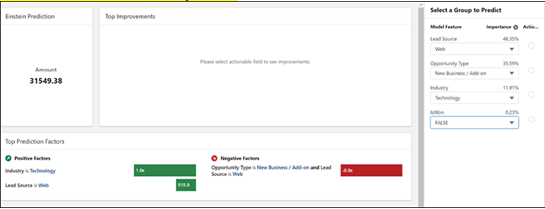
Finally, on the Predictions tab, shown in Figure 8.38, you can actually test out different values and see what the model predicts.

Figure 8.38: Predictions tab
Have a good play with the different aspects of the model, and now, we will move on to look at the Tableau Online Output Connection.

More Details
Jan 7, 2023
Building a lens – Blending Tableau with Traditional CRM Analytics

A lens is a visual representation of the data within a dataset, allowing you to explore data graphically and construct queries for a dashboard. To build a lens, follow the steps below:

  1. Click on the Analytics Studio tab to return to the CRM Analytics Home page.
  2. Click Browse and then select Datasets.
  3. Choose the opportunity_history dataset, which will open a new tab, shown below, with a lens for exploring the dataset.

Figure 8.10: Opportunity_history dataset details

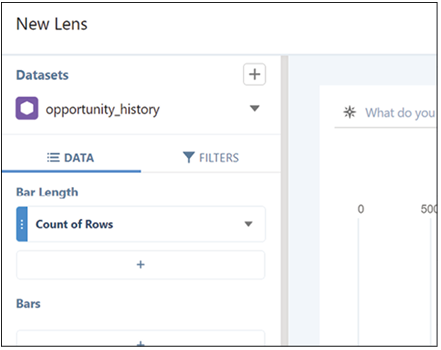
  1. In the New Lens tab, click on Count of Rows located beneath Bar Length, as shown in the following screenshot:

Figure 8.11: Lens builder with Count of Rows highlighted

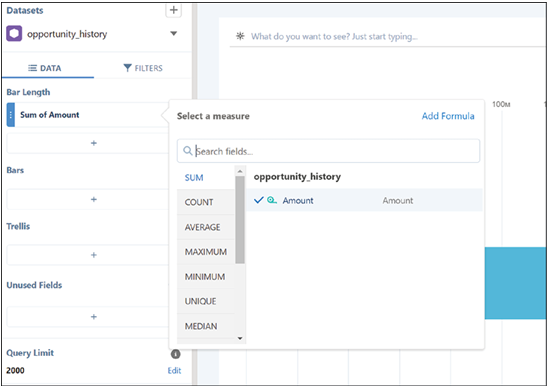
  1. Select Sum and then choose Amount from the dropdown menu, as shown in the next screenshot:

Figure 8.12: Sum Amount selected

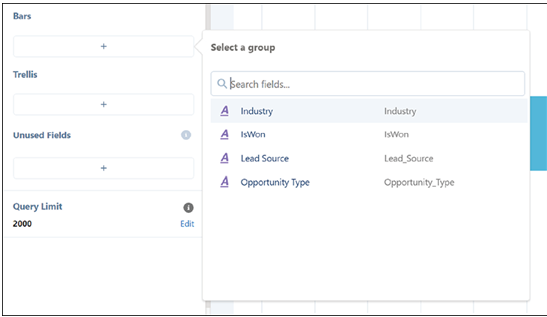
  1. Under Bars, click the plus sign (+) and select Industry, as shown below:

Figure 8.13: Industry field added to lens

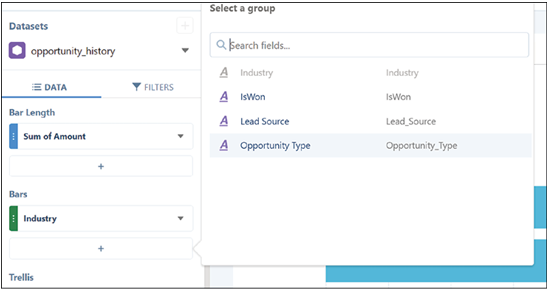
  1. Click the plus sign (+) under Bars again, and choose Opportunity Type, as shown below:

Figure 8.14: Opportunity Type added to lens

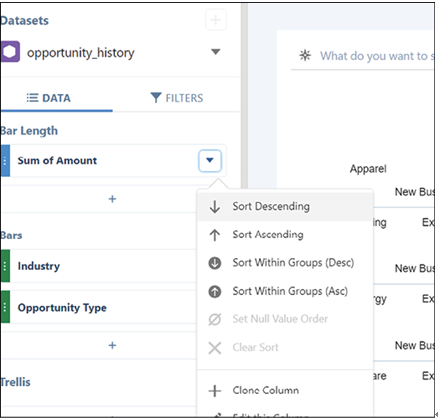
  1. Under Bar Length, click the arrow next to Sum of Amount and select Sort Descending, shown in Figure 8.15:

Figure 8.15: Sort descending selected

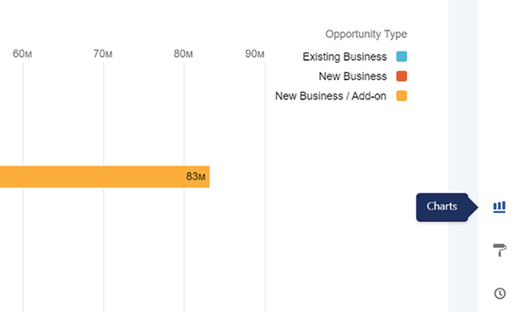
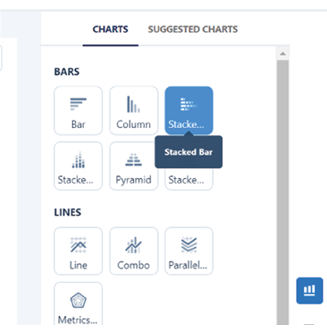
  1. Click the Charts icon to access different chart options, shown in the following screenshot:

Figure 8.16: Charts icon highlighted

  1. Select the Stacked Column chart icon, shown in the screenshot below, to create a Stacked Column chart, which will display the sum of the amount according to the industry.

Figure 8.17: Stacked column chart selected

  1. Save your lens by clicking the Save button.
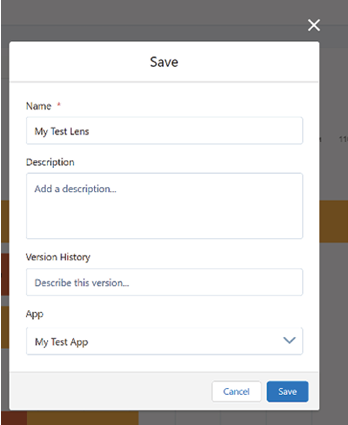
  2. Enter My Test Lens, indicated in the following screenshot, as the title of your new lens, and then choose App | My Test App from the dropdown menu.

Figure 8.18: Save lens dialogue

  1. Click Save to complete the process.
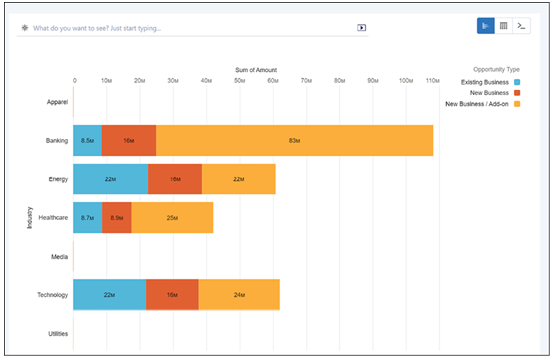
    Your final product should look like the following:

Figure 8.19: Completed stacked column lens visualization
With your app, dataset, and lens now created, you can proceed to create a dashboard.

More Details
Aug 7, 2022
Conclusion-Integration, Authentication, and Tableau Viz LWC

It is important to note that Tableau-connected apps and Salesforce-connected apps are different and offer distinct functionalities. Currently, Tableau connected apps are intended for embedding Tableau views and metrics in external applications and authorizing access to the Tableau REST API.

Generally, you should not use a Connected App with Salesforce. The one exception might be if you are planning to use the same app across several target systems that need to embed information from Tableau and should be managed in a consistent way. You would just be creating more trouble for yourself.

Finally, there is the option of embedding Tableau Dashboard as a canvas app using the Sparkler framework. This used to be the preferred way of embedding Tableau Dashboards into Salesforce, but it has now been superseded by the Tableau Viz LWC Component. The setup for this option is very complex. It involves a Java-based application, Sparkler, which can be used to embed Tableau dashboards in Salesforce using Salesforce’s canvas framework.

To set up Sparkler, you must download the adapter, create a virtual machine to run it, install Java 8, install Tomcat, enable HTTPS for Tomcat, install Sparkler, configure secure communication between Sparkler and Tableau Online, and configure a connection between Salesforce and Sparkler.

Finally, you must embed and filter the dashboard on a record in Lightning Experience by creating a new Visualforce page and customizing the record page. All in all, not something you want to do, given other options. However, you should know it as you could see it in a legacy environment.

Conclusion

In this chapter, we have provided a comprehensive guide on integrating Tableau with Salesforce using the Tableau Viz LWC component. You have learned the purpose and benefits of this integration, as well as the process of installing and configuring the Tableau Viz LWC component for seamless integration in Salesforce.

Furthermore, we have delved into advanced usage techniques, including the creation of custom visualizations and modifying the component’s settings. We have also covered the implementation of Single Sign-On (SSO) between Salesforce and Tableau to streamline the authentication process and enhance security.

Additionally, we have explored alternative methods for connecting Salesforce and Tableau dashboards, such as direct connections and third-party integration tools. With the knowledge gained from this chapter, you are now well-equipped to enhance your CRM analytics in Salesforce using the Tableau Viz LWC component and make more data-driven decisions to drive business success.

In the next chapter, we will dive deeper into how you can combine Tableau with CRM Analytics to create game-changing analytical use cases.

Join our book’s Discord space

Join the book’s Discord Workspace for Latest updates, Offers, Tech happenings around the world, New Release and Sessions with the Authors:

https://discord.bpbonline.com

More Details
May 15, 2022
Introducing CRM Analytics – Blending Tableau with Traditional CRM Analytics
CRM Analytics, formerly known as Tableau CRM and Einstein Analytics, is a powerful data analysis and business insights platform that provides users with a comprehensive way to analyze customer data and derive actionable insights. Integrated seamlessly with Salesforce CRM, CRM Analytics leverages the power of machine learning from Einstein Discovery to deliver intelligent analytics for businesses.

One of the key features of CRM Analytics is its native two-way integration with the rest of the Salesforce platform. This integration allows users to easily access and analyze data from their CRM system, creating a unified platform for managing customer relationships and analyzing customer data. Additionally, CRM Analytics offers on-platform data extraction and transformation, enabling businesses to process and prepare their data for further analysis.

CRM Analytics also provides external connectivity to various platforms and cloud storage providers, facilitating data ingestion from multiple sources. The platform enables users to visualize and explore their data through interactive dashboards, enhancing their ability to identify trends and patterns. Moreover, the data action framework allows users to make data-driven decisions based on the insights generated.

Embedded intelligence from Salesforce Einstein further enriches the analytical capabilities of CRM Analytics. This integration allows businesses to benefit from features such as Einstein Sentiment Analysis, providing deeper insights into customer data.

Another notable aspect of CRM Analytics is its integration with Tableau. By connecting CRM Analytics to Tableau, users can create interactive visualizations and insights using data from their CRM system. This enhances their ability to analyze and understand customer data, ultimately leading to improved customer relationships, increased sales, and enhanced overall business performance.

CRM Analytics offers businesses a powerful and comprehensive tool for analyzing customer data and making data-driven decisions. Through the creation of custom datasets and lenses, CRM Analytics empowers businesses to gain a deeper understanding of their customers and improve their relationships, all while leveraging the capabilities of Salesforce CRM.

The addition of CRM Analytics, therefore, adds another puzzle piece in the larger analytics picture for organizations that are invested in the Salesforce platform. We cannot cover this tool in detail in this book, but we will touch on some of the key places where it intersects with Tableau to give additional capabilities. First, however, we will look at how to do some basic analysis in CRM Analytics.

More Details