May 27, 2024
Combining Salesforce and Tableau for Advanced Analytics– Exploring Einstein AI and Advanced Analytics-2
We will test our Einstein Discovery model on the raw CSV that we used to create the model in the first place, follow the below mentioned steps:
- Start by creating a new Tableau workbook and connect to the opportunity_history.csv file you downloaded. You can see how this should look in Figure 9.10:
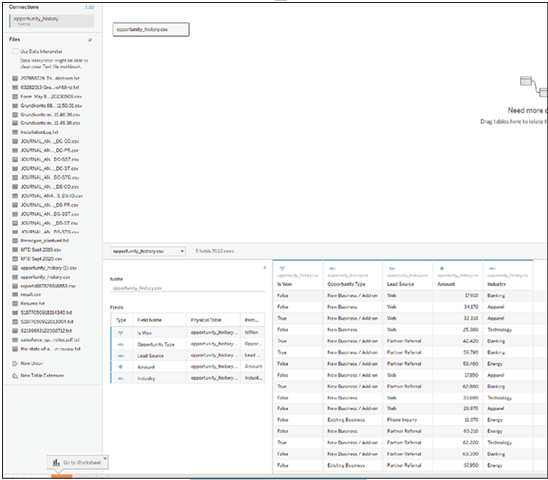
Figure 9.10: Connect Tableau to CSV
- Create a worksheet, like the one shown in Figure 9.11, with the four fields Is Won, Industry, Lead Source, and Opportunity Type. You can format this worksheet as you like, as long as the fields are present.
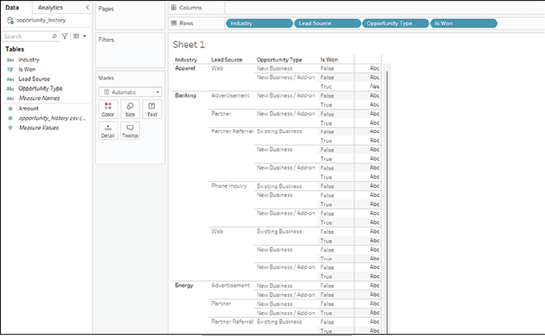
Figure 9.11: Create worksheet
- Now add a dashboard to the workbook and add the worksheet you have just created to it. You can see how this should look in Figure 9.12:
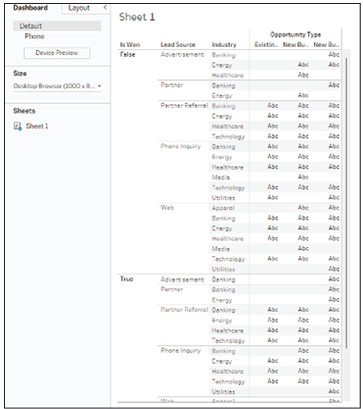
Figure 9.12: Add dashboard
- On the dashboard, add an Extension of type Einstein Discovery, as shown in Figure 9.13:
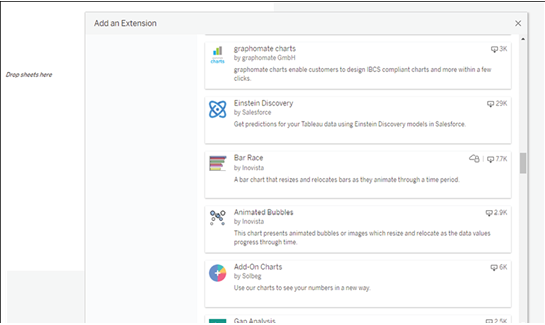
Figure 9.13: Add Einstein Discovery extension
- Click add to Dashboard, as shown in Figure 9.14:
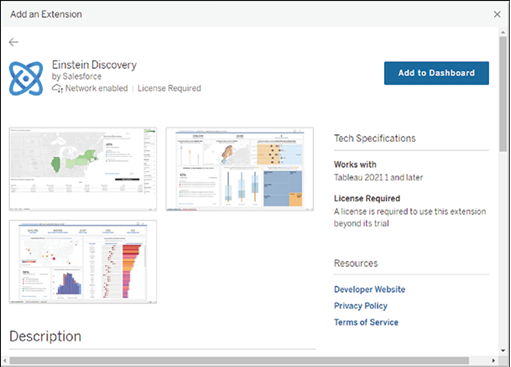
Figure 9.14: Add extension to dashboard
- You will now have to authenticate against your Salesforce org and allow your Tableau Desktop installation to access it. You can see this screen in Figure 9.15:
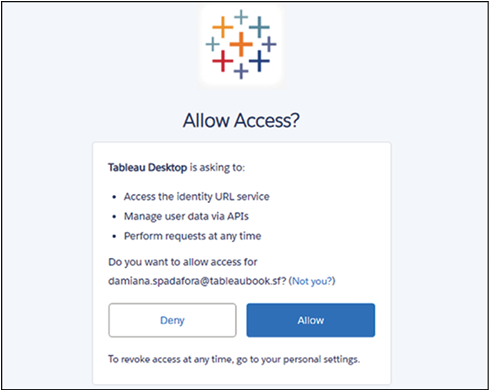
Figure 9.15: Authenticate Salesforce access
- The extension will now need to be configured, so click Open Settings, shown in Figure 9.16:
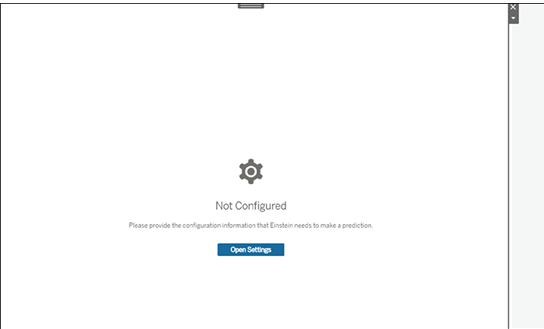
Figure 9.16: Open extension settings
- If you get an error at this point, you probably need to add the CRM Analytics Admin permission set to the user you are logged in as.
- Select the Predicted Amount model and the sheet you have just created in the dialog, shown in the following figure:
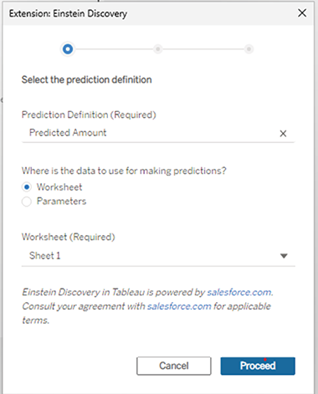
Figure 9.17: Select model and worksheet
- Map the fields to their worksheet equivalents, following the example in Figure 9.18:
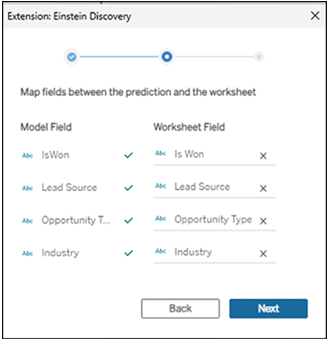
Figure 9.18: Map fields
- Leave all fields at their default values in the final screen, as shown in Figure 9.19:
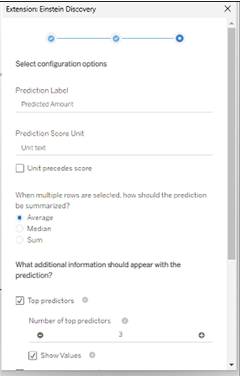
Figure 9.19: Extension settings
- You can now see your Einstein Discovery model directly in the worksheet and use standard worksheet controls to navigate and filter it. This should look like the Figure 9.20:
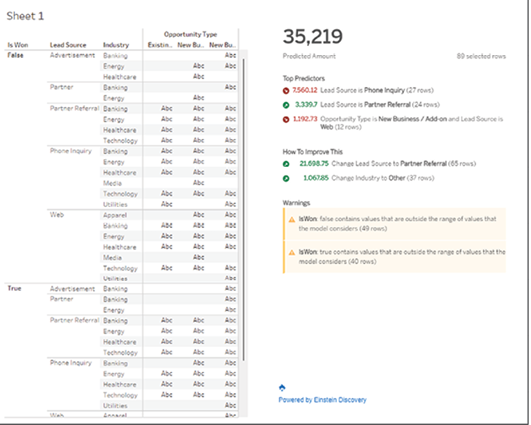
Figure 9.20: View predictions in worksheet
Congratulations, that was a hard task. Now, take a little break before going onto the final chapter in this book that deals with troubleshooting common issues and where to go from here.
Congratulations on reaching the conclusion of this rich journey into advanced analytics with Tableau and Salesforce! By now, you should have a solid understanding of the concept of advanced analytics and how it can elevate our data exploration to provide deeper insights and predictions.
Throughout this chapter, we have unlocked the power of Tableau’s advanced analytics, admired the intelligence of Salesforce’s Einstein platform, and learned how they can be harnessed to make data-driven decisions. We have also explored the synergy of these two platforms and their combined potential in enhancing your data analysis capabilities.
Remember, the field of advanced analytics is ever evolving, with new techniques and technologies constantly emerging. What you’ve learned here serves as a robust foundation, but there’s always more to discover and master. As we continuously strive for better data comprehension and predictive prowess, these tools will prove to be invaluable assets. Keep practicing, experimenting, and pushing the boundaries.
We will now move on to the final chapter of our book.
Join our book’s Discord space
Join the book’s Discord Workspace for Latest updates, Offers, Tech happenings around the world, New Release and Sessions with the Authors:
More Details