Dec 24, 2023
Tableau: Advanced analytics capabilities – Exploring Einstein AI and Advanced Analytics

Tableau and Salesforce provide powerful analytics capabilities that cater to both business users and data scientists. This comprehensive platform offers a wide range of features, including segmentation and cohort analysis, what-if and scenario analysis, sophisticated calculations, time-series and predictive analysis, and external services integration. By combining advanced analytics features with an intuitive interface, Tableau enables users to perform complex analyses and gain valuable insights from their data quickly and efficiently. Here are the applications:

  • Segmentation and cohort analysis Tableau enables quick, iterative analysis and comparison of segments to generate initial hypotheses and validate them. This section covers various capabilities in Tableau, such as:
  • Clustering: Tableau’s clustering feature uses unsupervised machine learning to segment data based on multiple variables.
  • Sets and set actions: Sets in Tableau allow defining collections of data objects either by manual selection or programmatic logic. Set Actions enable storing a selection of data points within a set, allowing for use cases like proportional brushing.
  • Groups: Groups in Tableau support creating ad-hoc categories and establishing hierarchies, which can help with basic data cleaning needs and structuring data intuitively for analysis tasks.
  • What-if and scenario analysis: Tableau enables users to experiment with inputs of their analysis and share scenarios while keeping data fresh using parameters and story points.
  • Parameters: Parameters in Tableau allow changing input values into a model or dashboard, driving calculations, altering filter thresholds, and selecting data.
  • Story points: Story points in Tableau enable constructing presentations that update with data changes and retain parameter values.
  • Sophisticated calculations: Tableau offers powerful capabilities to support complex logic using calculated fields. Two types of calculated fields that enable advanced analysis are:
    • Level of detail expressions: LOD Expressions in Tableau are an extension of the calculation language, enabling answering questions involving multiple levels of granularity in a single visualization.
    • Table calculations: Table calculations in Tableau enable relative computations applied to all values in a table and are often dependent on the table structure itself.
  • Time-series and predictive analysis: Tableau simplifies time-series analysis and offers predictive capabilities such as trending and forecasting.
  • Time-series analysis: Tableau’s flexible front end and powerful back end make time-series analysis a simple matter of asking the right questions.
  • Forecasting: Tableau’s forecasting functionality runs several different models in the background and selects the best one, automatically accounting for data issues such as seasonality.
  • External services integration: Tableau integrates with external services like Python, R, and MATLAB to expand functionality and leverage existing investments in other solutions.
  • Python, R, and MATLAB integrations: Tableau integrates directly with Python, R, and MATLAB, allowing users to call any function available in R or Python on data in Tableau and manipulate models created in these environments using Tableau.

In conclusion, Tableau’s advanced analytics capabilities make it a versatile and valuable tool for users at all levels of expertise. By offering a wide range of features, such as clustering, calculated fields, forecasting, and integration with Python, R, and MATLAB, Tableau empowers users to perform complex analyses and derive actionable insights from their data.

More Details
Oct 7, 2023
Advanced analytics – Exploring Einstein AI and Advanced Analytics

Advanced Analytics involves the independent or partially independent analysis of data or content using complex methods and tools. These often surpass the capabilities of standard Business Intelligence (BI), allowing for the uncovering of more profound insights, the making of predictions, or the provision of suggestions. Techniques employed in advanced analytics encompass data or text mining, machine learning, pattern identification, forecasting, visual representation, semantic and sentiment analysis, network and cluster analysis, multivariate statistics, graph analysis, simulation, complex event processing, and neural networks.

Advanced analytics applications in businesses are broad and varied, covering areas such as customer acquisition and retention, marketing efforts enhancement, risk management, and product development and innovation.

With the aid of advanced analytics, businesses can identify customer preferences, target their marketing efforts, foresee potential risks, and innovate in product development. Let us delve deeper into these applications:

  • Customer acquisition and retention: Advanced analytics can process customer interaction data, market research, and feedback to identify customer preference trends. Salesforce’s intelligent Customer 360 platform can be used here to provide a unified customer view, allowing businesses to meet and exceed customer expectations effectively.
  • Enhancing marketing efforts: Machine learning, business intelligence, and predictive modeling can enable companies to develop sophisticated marketing campaigns. Salesforce Marketing Cloud can assist in delivering personalized experiences to customers, tracking real-time behavior changes, and making data-driven decisions.
  • Improving risk management: Advanced analytics tools can model scenarios and forecast risks, guiding enterprises toward strategic risk management plans. Salesforce Shield provides a set of integrated services for managing business risks, from archiving sensitive data to implementing fine-grained user permissions.
  • Product development and innovation: By analyzing customer needs, advanced analytics tools can identify areas of improvement and potential new product niches. Salesforce’s Product Development Cloud can manage the entire lifecycle of product development, from ideation to launch.

Real-world applications of advanced analytics

Various global brands have harnessed the power of advanced analytics to drive their success. For instance, Amazon uses advanced analytics to provide personalized customer experiences. Starbucks optimizes its menu and product offerings through data analytics. American Express uses predictive modeling to anticipate potential customer churn and optimize marketing efforts.

Tableau, with its powerful data visualization capabilities, can be used to replicate these successes by presenting complex data in an understandable and actionable format. Whether it is predicting customer behavior like Amazon, optimizing product offerings like Starbucks, or forecasting customer churn like American Express, Tableau is a versatile tool in the hands of data scientists and analysts.

Advanced analytics is crucial for fostering innovation and improving business operations. By utilizing predictive analytics, businesses can make better-informed decisions and model outcomes beforehand. This capability allows businesses to craft strategic plans for all areas of operations, from customer service to digital marketing.

With technology’s evolution, the potential applications and capabilities of data science tools, like Salesforce and Tableau, are continually expanding. This advancement has reflected in the growing number of organizations planning to integrate advanced analytics into their decision-making models.

The future of advanced analytics will likely see more complex algorithms, more data science, and more process automation. Both Salesforce and Tableau, with their robust and continually improving features, are well-positioned to support this evolution.

More Details
Sep 1, 2023
Objectives – Exploring Einstein AI and Advanced Analytics

Introduction

This chapter will focus on the concept of advanced analytics and its applications in Tableau and Salesforce. The chapter will begin by defining advanced analytics and its capabilities in providing deeper insights and predictions from data. The chapter will then cover the use of advanced analytics in Tableau, highlighting relevant features. Additionally, the chapter will delve into advanced analytics in Salesforce, including its Einstein platform and its capabilities for machine learning and AI-powered insights. Lastly, the chapter will guide how to create a combined analytical use case across Tableau and Salesforce, leveraging the strengths of both platforms for enhanced data analysis and decision-making.

Structure

The chapter covers the following topics:

  • Advanced analytics
  • Using advanced analytics in Tableau
  • Using advanced analytics in Salesforce
  • Combining Tableau and Salesforce for advanced Analytics

Objectives

This chapter provides learners with a comprehensive understanding of advanced analytics and its significant role in interpreting data and aiding decision-making. It explores the potential of advanced analytics to yield deeper insights and more accurate predictions. Learners will discover how to harness the capabilities of advanced analytics in Tableau, leading to robust data visualization and exploration. The chapter also imparts knowledge about Salesforce’s Einstein platform, which incorporates machine learning and artificial intelligence to facilitate advanced analytics. Additionally, it explains how Salesforce utilizes advanced analytics to enhance customer relationship management and other business functions.

A key focus of the chapter is teaching learners how to create a combined analytical use case that leverages the strengths of both Tableau and Salesforce for improved data analysis. This involves understanding the integration and synergies between these platforms, which is crucial for optimizing their use in a business context. Finally, learners are encouraged to apply the techniques and knowledge acquired to real-world problems. This application not only enhances their data analysis skills but also bolsters their strategic decision-making capabilities, equipping them with the tools to make informed, data-driven decisions in various business scenarios.

More Details
Aug 17, 2023
Conclusion – Blending Tableau with Traditional CRM Analytics

In this chapter, we have journeyed through the crucial domain of CRM Analytics and its paramount role in understanding, managing, and improving customer relationships. You should now be able to grasp the full picture of CRM Analytics, its key features, and how it facilitates thorough analysis of customer data through datasets and lenses.

The concept of Einstein Discovery within Salesforce, and its application in the CRM Analytics platform, was another essential part of our journey. Now, you should be capable of creating and utilizing Einstein Discovery models to enhance your data interpretation and decision-making processes.

Finally, we discussed the use of the CRM Analytics Tableau Output Connector, a bridge that allows Salesforce data to flow seamlessly into Tableau. This key tool enables you to perform detailed, insightful analysis of your Salesforce data, further enriching your understanding and enabling you to derive practical benefits.

In sum, we have armed you with a comprehensive understanding of CRM Analytics within Salesforce, its integration with Tableau, and the immense value these tools bring to your organization. Now, you should feel confident to apply these skills in your own work, harnessing the power of CRM Analytics and Tableau to transform raw data into strategic actions, and thereby improve your business operations and customer relationships.

We will now move on to putting our hard work on setting up CRMA to use inside Tableau for advanced analytics use cases, while also covering the basics of what advanced analytics are really all about in the process.

Join our book’s Discord space

Join the book’s Discord Workspace for Latest updates, Offers, Tech happenings around the world, New Release and Sessions with the Authors:

https://discord.bpbonline.com

More Details
Jul 5, 2023
Using the Tableau online output connection – Blending Tableau with Traditional CRM Analytics

The Tableau Online Output Connector is a powerful tool that enables you to seamlessly push your prepared data from CRM Analytics into Tableau Online for further analysis. By transforming, merging, and cleaning your data in CRM Analytics, you can easily create a .hyper file that can be analyzed using Tableau Online’s advanced analytics tools. This connector is designed to work with Data Prep recipes and requires a Creator license for the Tableau Online account. In this section, we will walk you through the process of enabling the Tableau Online Output Connector, configuring connection settings, and pushing data to Tableau Online.
In this example, we will write the opportunity_history dataset that we have been using all through this chapter to our Tableau Cloud environment, using the Tableau Online Output Connector.
To do so follow the instructions below:

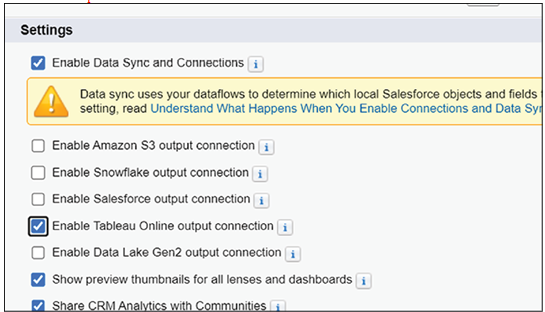
  1. First, go to setup and search for analytics in the Quick Find box. Click Settings.
  2. Under settings, shown in the following screenshot, enable the Tableau Online output connection and save:

Figure 8.39: Analytics settings showing Tableau connector

  1. Go to Analytics Studio and click Data Manager, then from the page that appears, click Connections. This should look like the following screenshot:

Figure 8.40: Data manager showing connections

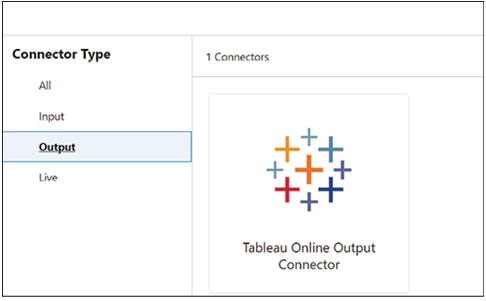
  1. Click New Connection, select Output under Connector Type and click Tableau Online Output Connector, as shown below:

Figure 8.41: New connection dialogue

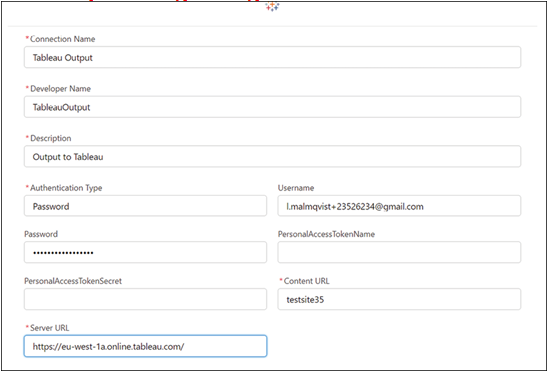
  1. Now fill in the information as in the screenshot below. You can refer to this URL for the details of the parameters if needed: https://help.salesforce.com/s/articleView?id=sf.bi_integrate_connectors_output_tableau_hyper.htm&type=5

Figure 8.42: Tableau Online connector configuration

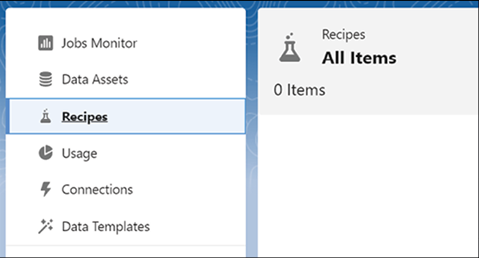
  1. Now you have established the connection. Time to test it. To do so, go back to Data Manager and click on Recipes, as shown in the following screenshot:

Figure 8.43: Data manager recipes tab

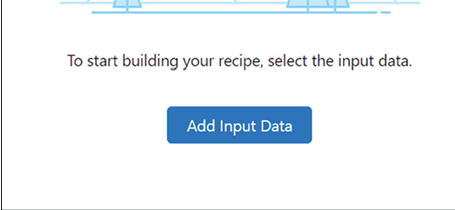
  1. On the Canvas that appears, click Add Input Data, shown in the following screenshot:

Figure 8.44: Add input data button

  1. Select the opportunity_history dataset, as shown in the following figure:

Figure 8.45: opportunity_history dataset selected as input

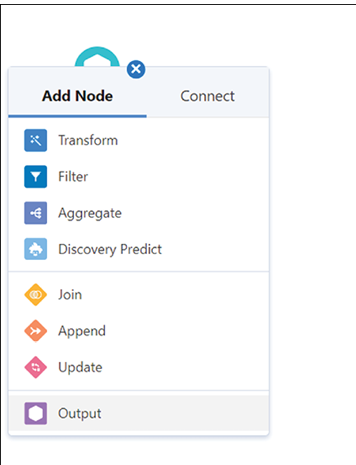
  1. Now add a node by clicking on “+”. Select Output, shown below:

Figure 8.46: Output node being added

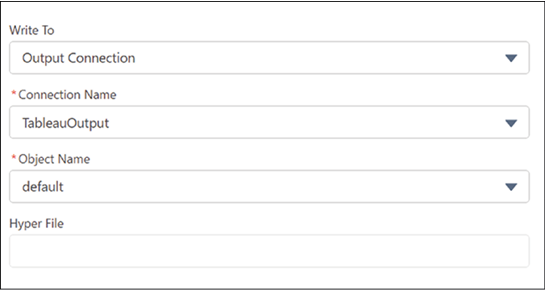
  1. Fill out the form as per the screenshot below:

Figure 8.47: Output node configuration

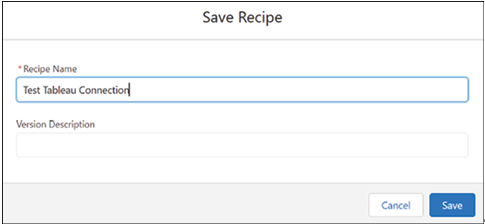
  1. Save and Run the Recipe by clicking on the button and giving it a name, for instance as in the following screenshot:

Figure 8.48: Save and run recipe dialogue

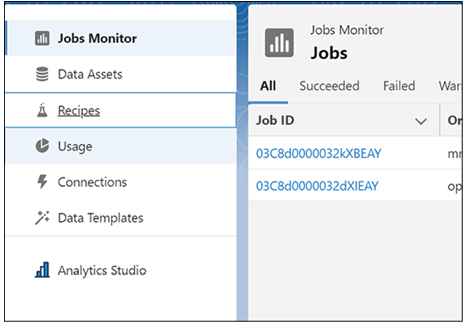
  1. The job will now run, so wait until it has been completed. You can monitor this in Jobs Monitor, shown in Figure 8.49:

Figure 8.49: Jobs monitor showing recipe run
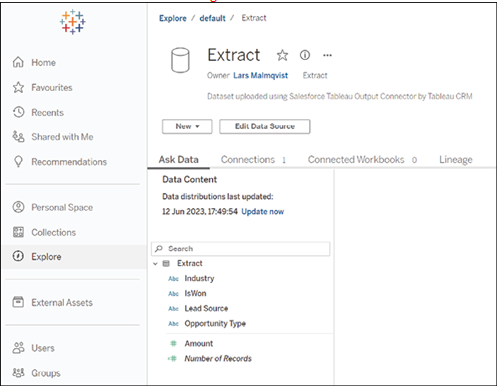
When the job is complete, you can find and explore the dataset in Tableau Cloud by clicking Explore, selecting default, and then clicking on Extract, which is the extract you have just created. This will look as in the following screenshot:

Figure 8.50: Explore dataset in Tableau dialogue
We have now covered the material for this chapter. Well done! However, we have even further heights to scale as we explore the world of advanced analytics in Chapter 9 – Exploring Einstein AI and Advanced Analytics.

More Details
May 3, 2023
Creating an Einstein Discovery Model and using it from CRM Analytics – Blending Tableau with Traditional CRM Analytics

Einstein Discovery, a cutting-edge machine learning platform developed by Salesforce, is designed to bring transparent predictions and recommendations to users within Tableau workflows and in Salesforce CRM. This powerful tool enables data scientists, analysts, and business users to create predictive models without writing any algorithms. With its intuitive, no-code environment, Einstein Discovery empowers individuals and organizations to make smarter, more informed decisions guided by ethical and transparent AI.
In this section, we will create an Einstein Discovery model based on our opportunity history data and investigate it within CRM Analytics. In Chapter 9 – Exploring Einstein AI and Advanced Analytics, we will examine how to use this model from within Tableau.
To create a model and investigate its parameters, use the following steps:

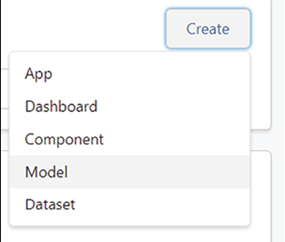
  1. Go to Analytics Studio and click Create | Model, as demonstrated in the following screenshot.

Figure 8.28: Model creation dialogue

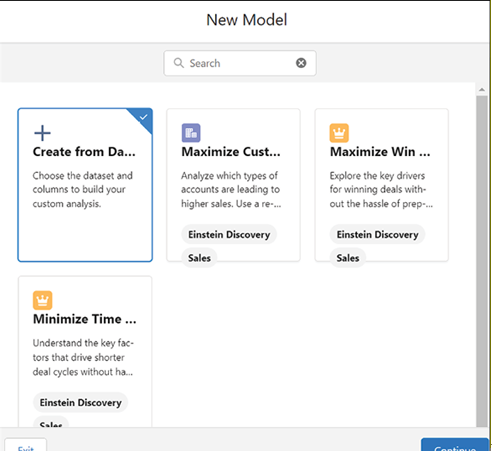
  1. Choose Create from Dataset in the dialogue that appears, shown below:

Figure 8.29: Create from dataset dialogue

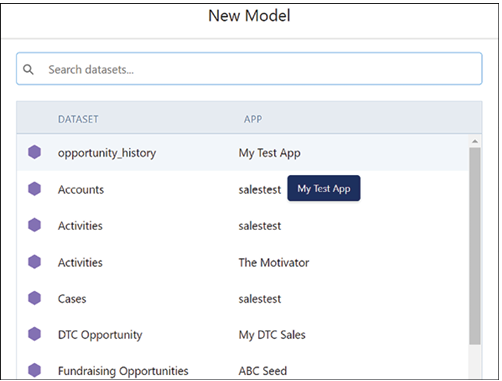
  1. Now select the opportunity_history dataset that we have previously created, as indicated in the following screenshot:

Figure 8.30: opportunity_history dataset selected

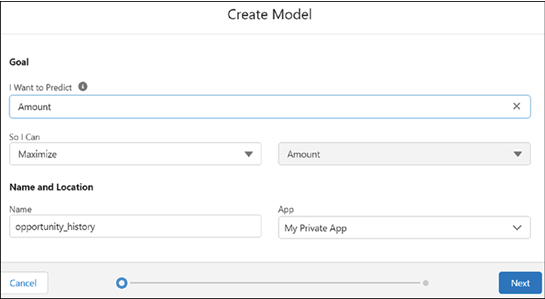
  1. As the goal, follow the settings in the following screenshot to maximize the amount of the opportunity:

Figure 8.31: Model goal configuration
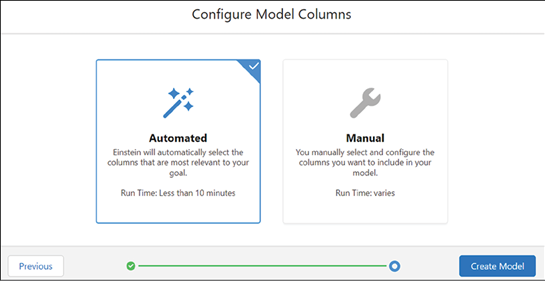
Einstein Discovery allows for considerable freedom in manually configuring the model that you want. However, for the purposes of this exercise, we will simply allow it to make the decisions itself. Therefore, select Automated in the Configure Model Columns dialogue. Note that this does mean we will take into account whether the opportunity was won or not, which you may want to exclude in a real scenario. However, in this scenario, the influence is not huge, so keeping it in does not materially change the result. You can see this in the following screenshot:

Figure 8.32: Automated configuration selected
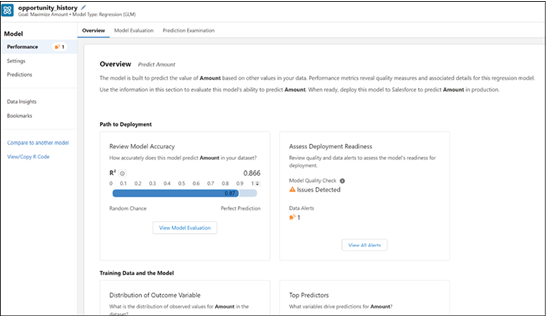
The system will now build your model, which usually takes 5 to 10 minutes. When it is done, you should see the following overview. You can check the alert and also note that at the highest level, shown in the screenshot below, the model’s prediction seems fairly good.

Figure 8.33: Model overview showing performance
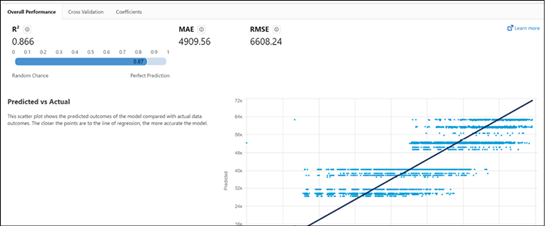
If you now click on the Model Evaluation tab, you can see more detail about the model performance. This is shown in Figure 8.34:

Figure 8.34: Model evaluation report
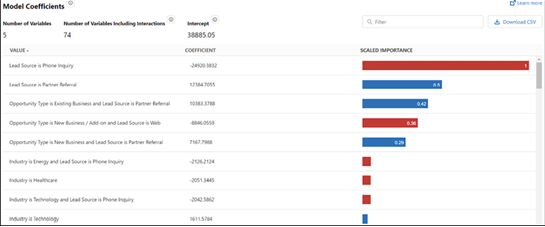
It is also worth going into the Model Coefficients tab, shown below, where you can see the most important variables in the model for predicting the opportunity amount.

Figure 8.35: Model coefficients tab
Now go into the Prediction Examination tab, shown in the following screenshot, where you can see how the model classified actual data from the training dataset. This can give you a good sense of how it will work in practice.

Figure 8.36: Prediction examination tab
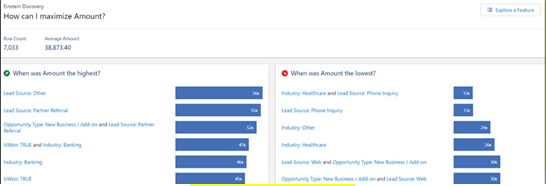
On the Data Insights tab, shown in Figure 8.37, accessible from the sidebar, you get an overview of what factors play the biggest role in making the amount high or low.

Figure 8.37: Data insights overview
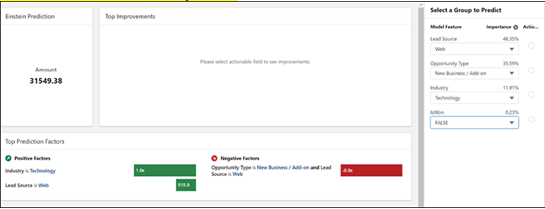
Finally, on the Predictions tab, shown in Figure 8.38, you can actually test out different values and see what the model predicts.

Figure 8.38: Predictions tab
Have a good play with the different aspects of the model, and now, we will move on to look at the Tableau Online Output Connection.

More Details
Mar 13, 2023
Making a dashboard – Blending Tableau with Traditional CRM Analytics

A dashboard is an engaging compilation of widgets that display the results of data queries. In this section, you will create a dashboard with an interactive chart and a list widget. You will incorporate the lens from the previous step and explore tools in the dashboard designer.
To incorporate a lens into a dashboard, you need to clip it. Clipping the lens allows CRM Analytics to add the query as a step in a new dashboard (or the most recently used open dashboard).

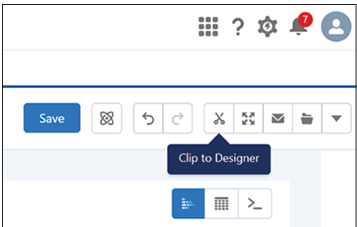
  1. In your newly created lens, click the Clip to Designer icon, marked in the following screenshot, to clip the query.

Figure 8.20: Clip to designer icon

  1. Under Display Label, enter Breakdown by Industry and click Clip to Designer.
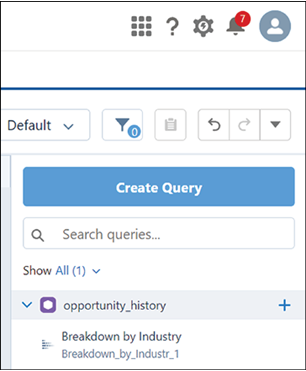
  2. CRM Analytics will open the dashboard designer and add the query in the query panel. Breakdown by Industry will be displayed under the opportunity_history dataset.

Figure 8.21: Lens added to designer with query name showing

  1. Drag the Breakdown by Industry query onto the new dashboard grid.
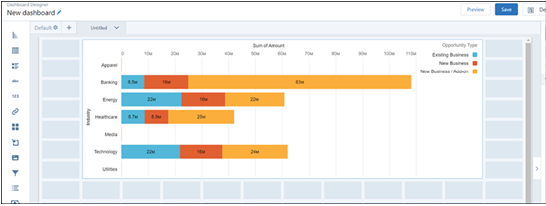
  2. Resize the chart by dragging its corner to make it larger. The result should look like the following screenshot:

Figure 8.22: Query chart resized on dashboard
Widgets are the basic building blocks of a dashboard, providing various functions such as displaying key performance indicators, filtering dashboard results, visualizing data using interactive charts, or showing record-level details in tables. In this step, you will add a list widget to enable dashboard users to facet all the charts in the dashboard.

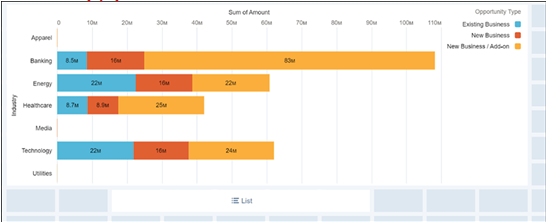
  1. Drag the List widget icon, shown in the screenshot, from the left side onto an empty space on the dashboard underneath the chart.

Figure 8.23: List widget being added to dashboard

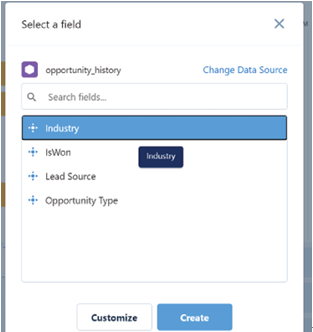
  1. Click on the List widget and select Industry.
  2. Click Create in the window shown in the next screenshot:

Figure 8.24: Industry field selected for list

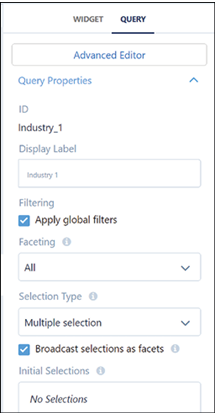
  1. Select the list widget by clicking on it.
  2. In the Properties panel on the right, click the Query tab.
  3. Ensure that both Apply global filters and Broadcast selections as facets are selected.
  4. Under Selection Type, choose Multiple Selection, shown in Figure 8.25:

Figure 8.25: List widget properties

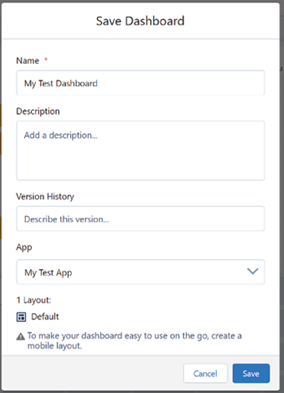
  1. Save your dashboard by clicking the Save button.
  2. Enter My Test Dashboard as the title of your new dashboard, and select App | My Test App from the dropdown menu, as shown below:

Figure 8.26: Save dashboard dialogue

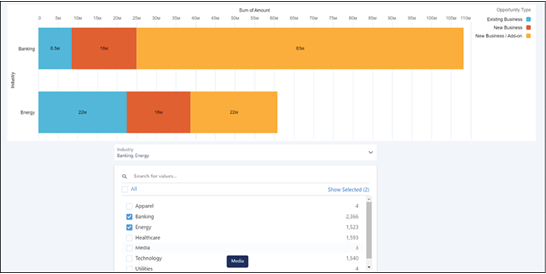
  1. Click Save to complete the process. You can preview your dashboard, which should look like this:

Figure 8.27: Completed test dashboard
You have now created a basic dashboard. We hope you will explore the potential of CRM Analytics much further on your own, but for now we will move on to Einstein Discovery, the machine learning engine that powers CRM Analytics.

More Details
Jan 7, 2023
Building a lens – Blending Tableau with Traditional CRM Analytics

A lens is a visual representation of the data within a dataset, allowing you to explore data graphically and construct queries for a dashboard. To build a lens, follow the steps below:

  1. Click on the Analytics Studio tab to return to the CRM Analytics Home page.
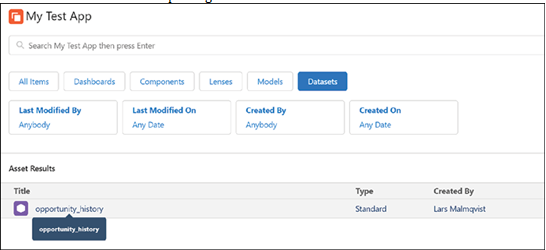
  2. Click Browse and then select Datasets.
  3. Choose the opportunity_history dataset, which will open a new tab, shown below, with a lens for exploring the dataset.

Figure 8.10: Opportunity_history dataset details
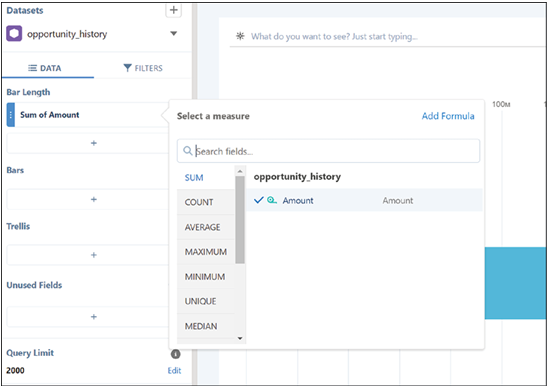
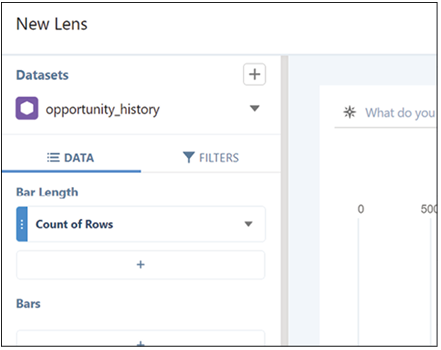
  1. In the New Lens tab, click on Count of Rows located beneath Bar Length, as shown in the following screenshot:
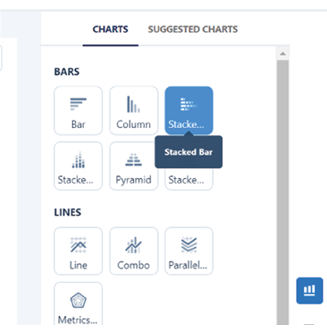
Figure 8.11: Lens builder with Count of Rows highlighted

  1. Select Sum and then choose Amount from the dropdown menu, as shown in the next screenshot:

Figure 8.12: Sum Amount selected

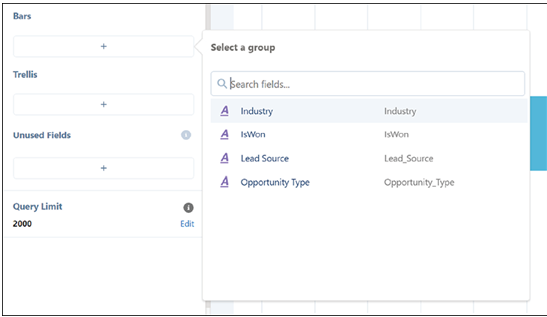
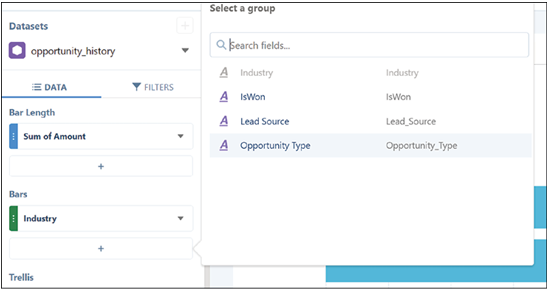
  1. Under Bars, click the plus sign (+) and select Industry, as shown below:

Figure 8.13: Industry field added to lens

  1. Click the plus sign (+) under Bars again, and choose Opportunity Type, as shown below:

Figure 8.14: Opportunity Type added to lens

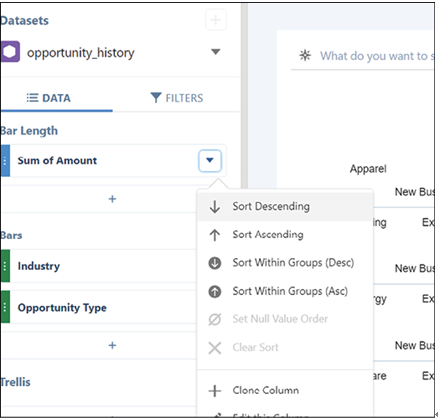
  1. Under Bar Length, click the arrow next to Sum of Amount and select Sort Descending, shown in Figure 8.15:

Figure 8.15: Sort descending selected

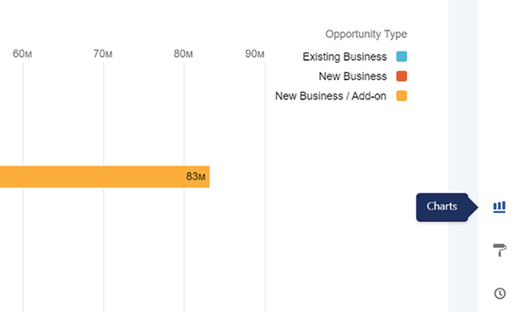
  1. Click the Charts icon to access different chart options, shown in the following screenshot:

Figure 8.16: Charts icon highlighted

  1. Select the Stacked Column chart icon, shown in the screenshot below, to create a Stacked Column chart, which will display the sum of the amount according to the industry.

Figure 8.17: Stacked column chart selected

  1. Save your lens by clicking the Save button.
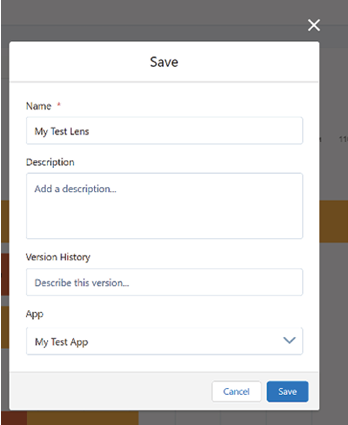
  2. Enter My Test Lens, indicated in the following screenshot, as the title of your new lens, and then choose App | My Test App from the dropdown menu.

Figure 8.18: Save lens dialogue

  1. Click Save to complete the process.
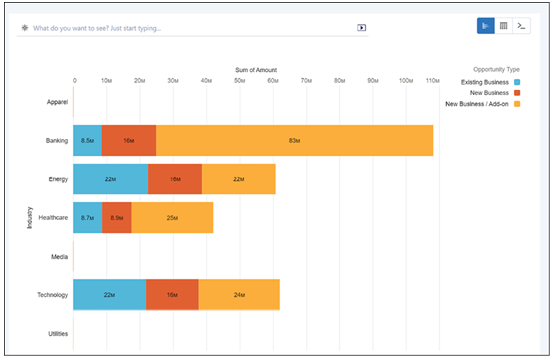
    Your final product should look like the following:

Figure 8.19: Completed stacked column lens visualization
With your app, dataset, and lens now created, you can proceed to create a dashboard.

More Details